Understanding Overbought and Oversold
If you are cooking something and you check on it and you see that it is “overdone” or “overcooked”, what is your immediate reaction? Exactly. You take the dish out of the oven. Remove it from what caused its current overdone state and the sooner the better.
Too late for our chicken dinner below…

What if your car’s engine is “overheated”? Same deal…you do what it takes to get the engine cooled down. Immediately stop doing what caused the engine to become overheated in the first place.

Given these natural reactions, it is easy to see why the initial and almost immediate move by many newer traders to an “overbought” or “oversold” trading scenario is to do the opposite in that case as well.
They reason that since many buy (long) orders moved price up and pushed the indicator into overbought territory, we must do the opposite and take a short (sell) position. Conversely, if many sell orders caused the price to drop and move into oversold territory we much begin to take long positions. It’s almost as though they expect price to snap back like a rubber band when it reaches these overextended zones.
Well…what is instinctively the proper reaction for chicken dinners and car engines is not necessarily the proper reaction when trading.
It is important to remember that when an indicator goes into the Overbought/Oversold areas, it can remain there for quite some time. Just because the RSI or Stochastics indicator reads overbought for example, does not mean that price action on the pair is like a tightly compressed spring that is going to immediately snap back toward the Oversold area.
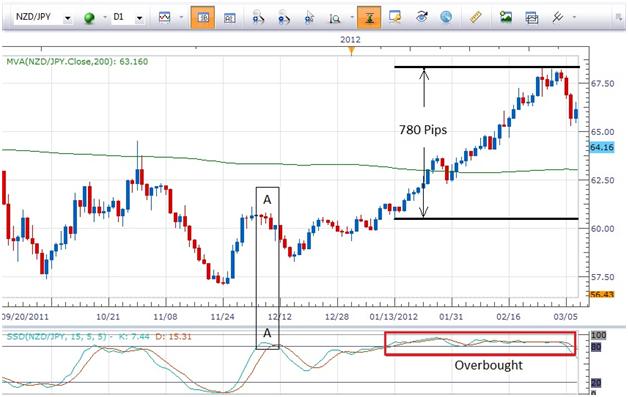
Let’s take a look at a historical Daily chart of the NZDJPY pair below for an example of this…
Notice on this chart that when Slow Stochastics went above 80 (in the red rectangle) into the overbought area, price continued to go up for another 780+ pips and Stochastics stayed overbought the entire time. Clearly a trader who went short when it first when into overbought territory would have missed out on a great move. They also would have gotten stopped out of their short position very quickly.
To see an example of where price retreats when Slow Stochastics goes into overbought territory we need to look no further than the area labeled “A” on the chart. In this case the candlesticks around “A”, dojis, spinning tops, shooting star and a hammer, indicate the potential for a pullback.
The point to be made is that either scenario can play out so don’t have a knee jerk reaction to the overbought and oversold areas of an indicator.
Remember…
Only take entry signals from an indicator that are in the direction of the longer term trend.
For example, if the trend has been strong and prolonged to the upside, it stands to reason that the indicator will be in overbought territory since it reflects the bullish push of price action. To take a short position at that point would to trade against the trend and that would be introducing more risk into the trade.