Getting to Grips with the Guppy
One of the most frustrating things about constructing a trading system can be the absolute freedom to use whatever indicators and values you like.
While this can initially sound positive, the virtually limitless combinations of variables can become quite overwhelming. For example, if you like the concept of the SPY 10/100 SMA Long Only System that I covered, you can implement it using any two simple moving averages you like, but which two should you use?
What is the GMMA Indicator?
The Guppy Multiple Moving Average (GMMA) Indicator provides an interesting alternative to using any variable you like. Developed by Australian trader Daryl Guppy, the GMMA implements 12 different exponential moving averages (EMAs) in an effort to analyze a market’s behavior on multiple levels.
Guppy groups the EMAs into two categories. The first six are considered short-term and the other six are considered long-term. The short-term EMAs used are 3, 5, 8, 10, 12, and 18. The long-term EMAs used are 30, 35, 40, 45, 50, and 60.
The long-term EMAs represent the interests and behaviors of investors that have taken a long-term approach to a given market. The short-term EMAs represent traders, or speculators, who are attempting to capture short-term profits.
Crossover Systems
The simplest method for using the Guppy Multiple Moving Average indicator is to trade a basic moving average crossover system using all twelve of the GMMA EMAs. This system would buy when all of the short-term EMAs cross above all of the long-term EMAs, and sell when the short term EMAs cross below the long-term EMAs.
Guppy has suggested that this system could be programmed into your trading software by tracking the sum of the six short-term EMAs against the sum of the six long-term EMAs. When the sum of the short-term EMAs crosses above the sum of the long-term EMAs, a buy signal would be generated.
Trend Strength
Another application of the GMMA indicator is using it to analyze the strength of a current trend, or to target additional entry points within a trend. This can be done by analyzing how the different EMAs interact with each other.
Both the long-term and short-term trends are seen as stable when each of their EMA lines are separated by a uniform distance. If the six long-term EMAs begin to flatten, the long-term trend has become vulnerable. If the short-term EMA lines begin to separate further and further from each other, the market is likely experiencing a bubble situation and traders should be cautious.
The GMMA in Practice
SPY
Looking at the GMMA lines on the current chart of the SPY, we can see a number of these principles in action. Notice how tight the long-term EMAs were trading with respect to each other in November and December of last year when the short-term lines crossed through them. This was the start of the new uptrend.
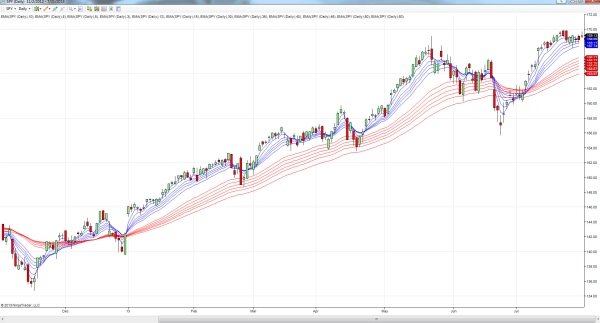
Then, those long term EMAs expanded with respect to each other as the uptrend progressed. The long term EMAs traded tighter again at the end of June, indicating weakness, but have since spread further apart.
It is also interesting to note that at each of the relative highs and lows, the fastest short term EMAs opened bigger gaps over the slightly slower short term EMAs. This can be seen at the low point at the end of November, and at the relative high in the middle of May.
Trading the crosses of the long-term and short-term lines would have established a long position in December that would have lasted all the way through June, locking in most of this year’s profitable trend. After a few choppy weeks, the uptrend resumed at the beginning of July and would currently be holding a long position.
FXI
Trading the GMMA indicator on the FXI chart would have resulted in a few more signals this year. Almost all of them would have resulted in profitable trades.
The long position signaled in December would have retained most of its profits when it was sold in February. Then, a short position established at the end of February would have ended profitably at the end of April.
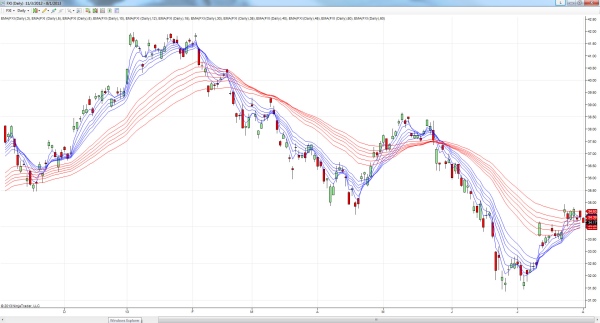
The long position triggered in May would have been sold at close to break-even, but the short position signaled in June would have turned a profit when sold in July.