The Accumulation/Distribution Indicator
A double bottom that fails to hold, resistance that gets sliced in a heartbeat or just a trend that surprisingly breaks. Those are just a few of the“nasty“ pitfalls that nearly every trader regularly encounters. Those pitfalls are seemingly out of the blue but are, in fact, just a result of another dimension acting in parallel to the price. That dimension? The money flow. Determining where the money is flowing is exactly what the Accumulation/Distribution Indicator does and does quite well, one might add.
Accumulation/Distribution Indicator: The Basics
The Accumulation/Distribution Indicator, which was developed by Marc Chaikin, was designed to capture the accumulated money flow into an instrument.
The indicator formula factors in for each period (daily, weekly, etc.) the difference in the closing price to the lowest price and to the highest price, and the difference between the instrument’s high and low and, of course, the volume. Moreover, all of the values are accumulated; each reading is added to the last, thus accumulating the values.
The fact that the indicator is built on accumulation allows it to take into account the money flow. That provides the trader with a much clearer glance at the big picture as to how money flows over time in to or out from a pair, rather than just capturing a quick swing as many oscillators do.
The Accumulation/Distribution Indicator does not require any specific parameter; rather, the values are accumulated per candle. For example, if the period is daily, then the indicator accumulates volumes on a daily basis, and so on.
In general, as a rule of thumb, the best periods of the Accumulated/Distribution Indicator are weekly and greater. That’s because, in a daily interval scenario, the volumes can sometimes be irregularly high, often as a result of some short-term, perhaps even insignificant, event. But, for a week to have a high volume, the reason for it has to be much more significant, and that makes the indicator more effective and accurate; the higher you go on the interval, the better the accuracy, and vice versa.
Down to Practice
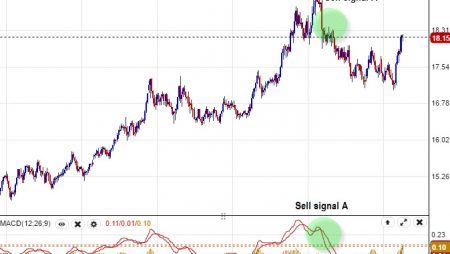
So, how do we translate the Accumulated/Distribution Indicator into an effective strategy? I find the most practical way to use the indicator is by stretching a trendline below it, and then dividing it into four different signals—Up, Down and Sideways (Up, then Sideways or Down, then Sideways). The Up signal is when the indicator is rising and signals an inflow of funds. The Down is when the indicator is falling and signals an outflow of funds.
In either of the two Sideways signal there is generally a freeze, an indication of low volumes and low activity. The Sideway signal is very important because it usually comes after strong inflows or outflows and it signals the exhaustion of the trend. If an Up signal turns into a Sideways signal, it means money inflows are topping out and money outflows could soon appear. If the Sideways signal comes after a Down signal it could mean that money outflows have been exhausted and money inflows could soon appear.
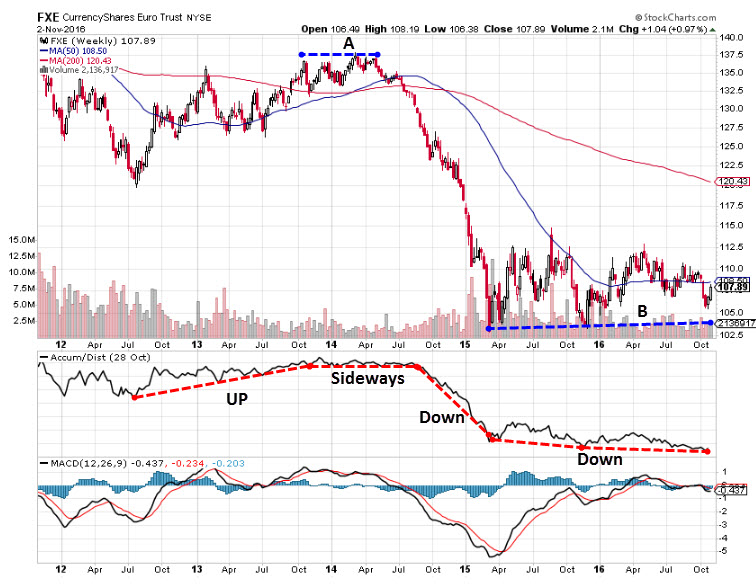
Now, let’s examine the chart above and see how those signals can help avoid the usual pitfalls.
Resistance- We can see that during the first Up signal, the pair was heading towards a resistance at Zone A. But what we see is that as the pair headed towards Zone A, our signal below turns from Up to Sideways. This means that, as soon as the pair reached the resistance, the money inflows stopped. The conclusion? The resistance is not likely to break. If the signal would have stayed Up, with the indicator rising, it would mean more money inflows ahead of the resistance, and that could signal a break.
Double Bottom – In Zone B, we can see the pair has created a double bottom, a classic pattern for a rebound. And yet the Accumulation/Distribution Indicator is still Down. And that means that the double bottom pattern is not strong enough to stop the money outflows and, therefore, might not hold. Seemingly, as long as the signal is still down, the pair could trend higher (slightly) but, overall, the trend is still down, despite the double bottom. While this is not a signal for short sellers to enter into a new short position, it is certainly a signal for buyers to avoid a buy position. That is unless the signal turns Sideways. But, as long as the signal is Down, even if it is at a slower pace, the double bottom is not strong enough for a rebound.
In addition, since it’s usually mentioned in the educational materials, it’s worth mentioning here that if the Accumulation/Distribution Indicator is diverging from the price trend it means that the trend is not reliable. However, usually, the divergence will not be an outright divergence with the indicator moving in the opposite direction to a price, but more of a sideways state while the price continues to move. This, of course, suggests that the trend is weak and might end abruptly.
One other issue worth mentioning is that you should check to see if your platform enables you to see volumes on FX pairs, which is a critical component for the Accumulation/Distribution Indicator. But, once the volume is set, the Accumulation/Distribution Indicator can be counted upon and, as can be seen in our sample, can save you from many pitfalls.