Lessons from a Decade of Trading the JPY
written by
The past decade has been a turbulent one for the Japanese Yen, or the JPY as it’s familiarly known. The Yen’s multi-year bullish trend which started in the 1990s ended and it flipped into a brutal bearish correction. Moreover, the Bank of Japan embarked on an unprecedented journey of more and more Quantitative Easing, effectively printing trillions of Yens to revive its stagnant economy. And finally, let us not forget the tsunami that hit Japan’s coastline in 2011 which tragically took a very hefty toll in human lives and which sent jitters across Yen pairs.
So, why am I dwelling on this? Because this decade of Yen turbulence has provided us with some very important trading lessons on the JPY, specifically, and on trading, in general. In this article, I will elaborate on two important lessons for both the novice and experienced traders that I’ve learned through trading which may not be immediately intuitive.
JPY Lesson on Natural Disasters
In the period that preceded the 2011 tsunami, I was expecting a major turnaround specifically in the trend of the USD/JPY, and in the Japanese Yen, generally. As I’ve often said, the longer the duration of your trade the more fundamentals will have an impact on the trend. Back in 2010-2011, I was focusing on the Japanese Yen which was in a multi-year bullish trend and so fundamentals were critical. Japan’s economy was suffering from persistent deflation and weak economic performance and that warranted a massive stimulus. Of course, any form of stimulus, either monetarily from the central bank or fiscally from the government, usually means a weaker currency. And so, that meant the end of the Yen’s strength and the start of a bullish trend in the USD/JPY (which moves in reverse). That meant that the bearish trend of 13 years would finally come to an end. Of course, that is provided stimulus would be forthcoming, which I thought was very likely.
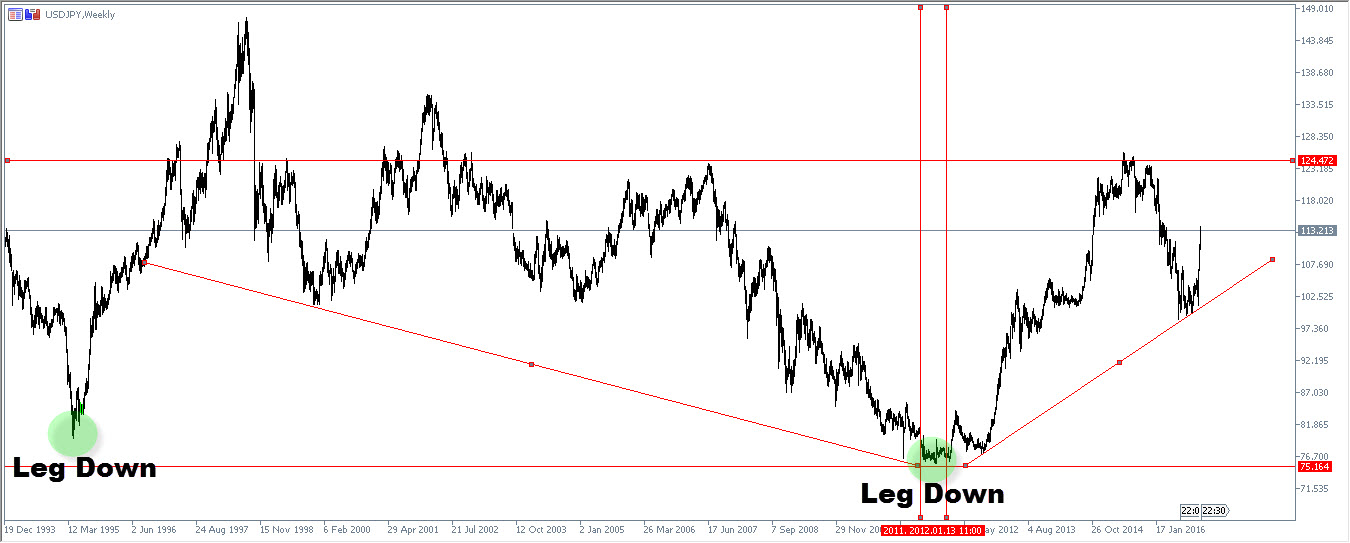
Then, on March 11, 2011, the tsunami hit the coast of Japan. And as hysteria hit the markets, the USD/JPY plunged. Investors were crowding in to safety and speculation grew that the Yen’s long-term trend of appreciation would intensify as investors sought shelter.
The USD/JPY tested the 76 level and bounced back after a concerted effort by central banks across the world. Several months later, the pair finally bottomed out at a slightly lower level of 75. And the bullish rebound, aka weaker JPY, started in 2012.
What is the lesson? The lesson is that natural disasters in large economies, even severe ones, generally cannot change the long-term economic fundamentals and, therefore, cannot change a currency’s long-term trajectory. The JPY eventually had its trajectory to playout, i.e. the bottom, and the rebound took place only a few months later.
That means that even a disaster of this magnitude should not change your long-term strategy. Since a natural disaster can create short-term volatility it could present an opportunity to ride a long-term trend or a long-term turnaround at a more convenient entry.
JPY: Leg Down Vs Double Bottom
When we look at the USD/JPY bottoming out during 2012, we can see a rather interesting pattern. Rather than a double bottom warranted after a multi-year bearish trend (bullish JPY), what we see is a bullish wave right after the last bearish wave. The intermediate zone between is uncharacteristically short and the range uncharacteristically narrow. One common mistake is just to assume we had a swift bottoming out process, but the real answer is that that is a leg down and not a double bottom.

The key difference between a leg down and a double bottom is highly practical from a trading standpoint. On a double bottom the rebound takes much longer, with the pair fluctuating at lower levels for longer. Once the short sellers are shaken off, the rebound begins. On the other hand, in a leg down scenario the rebound is much quicker. But there is a price for that quick rebound. Because a leg down does not validate a change of trend, our prudent assumption should be that the bearish trend line should be respected and we should target Point X rather than Point M, at the peak of the last wave. Lastly, a leg down would mean another leg down is required over the long run and that means that we should be alert to a potential change over the very long run.

What is the lesson? A leg down means a quicker rebound but with a lower potential while a double bottom means a slower rebound but one that lasts much longer. And, of course, we should always be on alert for another leg down. It should be noted, however, that that might take a long while especially in the case in which Point M is broken, which would signal a much wider rebound.