Fade Range Reversals For Rich Rewards
Fading range reversals is a powerful forex trading strategy. This “fading” strategy capitalizes on markets’ tendency to revert back toward their mean values in time. It relies on simple rules, and there’s plenty of room for adjusting it to fit any market.
Range reversal signals rely on input from earlier-opening markets, which can provide the set-ups for successful trades later during the global business day.
Forex traders often watch the range of a currency pair’s price for clues as to expected price movements during a later-opening marketplace, and the possibility of tradable price reversals.
Two of the most effective reversal indicators are the average daily range (ADR) and the average true range (ATR). They can be used together or separately to signal trading opportunities from range reversals.
Range reversal opportunities
Many experienced traders have noted a tendency for the major currency pairs to reach their intra-session maximums during the New York session. This session is pivotal for the sizes of ranges to be achieved in other sessions.
As well, all markets on opening at least acknowledge the last prices of earlier markets
So, it makes sense to develop mechanical trading systems to harvest gains from these fairly predictable phenomena. Expert advisors (EA) and mechanical trading systems can often find price levels where a currency pair is likely to reach the extent of its range, before moving back inside that range.

The best-designed systems focus on finding high-probability set-ups where the price is likely to complete its range move after the markets open in New York.
Below, I’ve outlined my fading range-reversal forex strategy, which lets me harness the power of probability and the law of reversion-to-mean for profitable trading.
“Reversion to mean” means predictable gains
The range reversal strategy is based on the concept of reversion to mean, which is also sometimes called regression toward the mean.
In financial markets, this concept refers to the mathematical law which says that if a price is extreme during one or a few measurements, that price will tend to be found closer to the average price once subsequent additional measurements are made.
In other words, anytime you see a price outside its normal nearby range it will usually quickly return to a level within that range. Over time, prices tend to return to the average over the entire set of data.
So, with regard to the range reversal strategy, the forex trading system assumes that during each individual trading session or shorter time-frame, a currency pair’s price move will become exhausted at a certain “average” point. At that point, the price will probably reverse and return back within the limits of its average daily range.
My range reversal trading strategy is focused on fading the daily momentum in anticipation that the price is expected to regress toward its mean, that is, move back toward its average range.
Average daily range & average true range
Even in spite of volatility, currency pair prices generally move with a fairly predictable range each session. Under typical market conditions, a price moves around a range calculation called the average daily range (ADR).
The average daily range (ADR) is simply the average of the daily price range calculated for a given number of days.
The average true range (ATR) is a bit more discriminatory of price range during gap-ups or gap-downs. The ATR is calculated as the greatest value of the following:
• Current high minus current low
• Absolute value of current high minus the previous close
• Absolute value of current low minus previous close
The ATR represents a moving average (usually a 14-day MA) of the individual true ranges.
The benefits of using ATR & ADR
The value of these daily range indicators is that they show the volatility of the currency price and also indicate likely reversal points. When the range increases, it shows the price is volatile.
The range reversal strategy works well when both indicators are employed, since the ADR provides a baseline and the ATR accounts for gap-price volatility.
ADR and ATR are easily determined by mechanical trading systems; the most popular time periods are 5, 10, or 20 days. After determining the typical ranges for the targeted currency pairs, the system looks at the day’s open for a given time frame, say from midnight, and then calculates the target price area for trading signals.
For example, let’s use EUR-USD with an ADR indicator, and assume an opening at 12 a.m. ET at a price of 1.2300. The strategy allows the price to make its primary move from 12 a.m. to 5 a.m. ET. During this time period, the price typically sets up or forms the “high” and “low” for the day.
The session opened at midnight ET at 1.2880. Next, as the London session opened, the price dropped to a low 1.2788 before again moving back upward to 1.2811 just before the opening of the New York session.
First, determine support and resistance
During the New York session the trading system automatically looks for support if the price keeps moving downward, or for resistance if price moves strongly upward. Let’s assume that the ADR is calculated as 120 pips.
So, the EUR-USD pair should find support near 1.2760. In this case, the ADR is calculated by subtracting the daily session high minus the daily session low.
On the other hand, if the low price at 1.2788 is sustained and the euro enjoys plenty of buying during the New York session and moves still higher, then the probable next resistance will be around the 1.2910 level.
The system calculates this number by taking the day’s low and adding the Average Daily Range (120 pips in this example) onto it. In either case, the trading system signals support and resistance levels during the New York session.
Find support and resistance levels for the next-highest time-frames
After the trading system determines where the price is located in relation to the ADR, the next step is to find the support/resistance levels calculated for each of the next-highest time-frames, which are typically 1-hour or 4-hour time-frames.
Often, there is plenty of support/resistance in targeted areas, and trading signals should be confirmed by using multiple indicators. Many different technical tools could be used, but Fibonacci retracements and extensions, pivot points, and retracements are some of the best.
Above is a 4-hour chart. You’ll see there’s significant resistance around 1.2910. From a technical viewpoint, this shows the previous high swing on the 4-hour chart, and in the left area you’ll see there’s been strong support during a period of several days. The green boxes show a number of faltered attempts by price to move outside the target area.
For the downside, in this case the 1.2760 price level is at or near the trading system’s calculated value for a 50% Fibonacci retracement of the last swing from the 4-hour time-frame. This move is significant. This level may act as support, or the price may break through this level.
Once the price breaks through that level, it should then act as support if the EUR-USD continues to move downward during the remainder of the New York session. In fact, it can be seen that the 1.2760 level has been an area of price support before.
The trading plan
The trading system has confirmed support around 1.2760 as well as resistance around the 1.2910 level.
When the price begins its move toward one of these two levels during the New York session, the system is standing by, ready to “fade” the session’s momentum and ride the currency pair’s price back into its average daily range or average true range.
The overall goal is to find situations in which momentum has built up, then capitalize on the residual momentum to ride the price back toward its range for a fair profit.
As mentioned earlier, the range reversal is a mean-reversion strategy. In the chart below are some examples of where to apply this strategy, and what to avoid.

The range reversal strategy takes advantage of the probability that, as the price exhausts the movement of its daily range, it will reverse and return back into or toward the ADR in a show of reversion to the mean price.
Even while expanding its range intra-session, the price tends to reverse itself at some point and move back toward one end of the range before resuming its move toward the other extreme.
The trading system relies on a variety of tools to determine support-resistance, including Fibonacci indicators. The system identifies the reversal point, usually at a recent strong resistance or support level.
Fading the range reversal
When the currency pair’s price reaches that reversal point, the system enters a trade which “fades” the price move. It’s expected that the price will return back inside the daily range, or perhaps expand to fill it.
Fading means trading against the current trend, with the expectation that the price will return to its normal daily range. This is a contrarian strategy, since the trading system sells when the price is rising and buys when the price is dropping.
The chart above illustrates three scenarios: The first situation shows a high-likelihood set-up, then the next two situations represent trading signals that should be screened to improve the trading system’s performance.
It’s been said that a range expansion is a very clear signal the market will soon move in the direction of the expansion
In the first situation shown in the chart above, the Euro first became stronger during the Asian session, then the price reversed from support levels of the previous, all just prior to the opening of the London session. At that point the ADR indicator began rising, which signals a range expansion.
During the London session, the price added 55 pips, which is far short of its average daily range of 120, which lays out the scenario for the upcoming opening of the New York session. By adjusting these values, the trading system improves its success rate through better set-ups.
The successful range reversal trade features these elements – A reversal from a support or resistance level, a range expansion, the trend wave is pointing upward, and there’s a tradable opportunity in the remaining average daily range.
The range reversal strategy doesn’t always work, as shown by the last two example set-ups in the chart. In the second scenario, the Euro’s price continued upward, but then reversed strongly during the London session, when it over-ran its ATR by 60 pips. The trading in New York was flat.
In the third set-up shown, the advantage of a mechanical trading system is that it should screen this signal and avoid the trade based on the fact that the force of the move has already been spent. There’s not enough trading activity to repeat the previous performance.
Screening range reversal signals
As seen on the chart, when the minimum and maximum values of the ATR (ADR) are very close together, it indicates that volatility has been exhausted, and trading activity needs time to rest.
Because of the risks from holding “fade” positions during reversing markets, the range reversal strategy favors quick-in, quick-out trading methods. Since the trading system has already pre-calculated the average true range, the rate of momentum, and the amount left for potential gains, the profit expectations must be tailored to fit the marketplace.
Also, it’s important that the trading system screen and reject any trades that are signaled if (1) the price’s average daily range has already been surpassed during the London session, or (2) the signal was generated when volatility reached exceptionally high and low levels during a very short period of time.
Entries
The entry points are determined based on the key resistance and support levels, plus Fibonacci levels. And, the ADR or ATR indicators are assessed in view of the range for the London session.
Returning now to dissect the trading opportunity in the first scenario shown on the above chart, it helps to take a look at the price under a microscope, by using a 15-minute chart, as shown below.
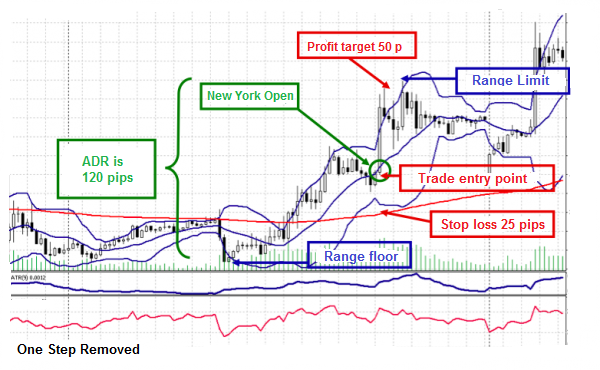
Again, the focus is to adjust the trading system according to what may happen during the New York trading session. In this example, the price momentum began in London, and all indicators suggested that the price move would continue once the New York market opened.
The trading system chooses an entry point just after the typical profit-taking on any positive run-up, which usually happens just before New York opens.
The system can calculate a stop-loss order to meet precise needs for risk management. The typical stop-loss amount is usually 25 or 30 pips.
Range reversal profit-taking
Using a 2 x 1 reward-to-risk ratio calculated based on the stop-loss, the profit targets should be set at a minimum twice the stop-loss amount. It’s best when the stop-loss amount is near the projected upper limit of the ADR or ATR.
It’s important not to become greedy when using the range reversal strategy. Patience is also necessary, since it may take some time to fine-tune the trading system for shorter time-frames.
Keep in mind that there are other trading systems using similar strategies, so it’s always best to get in and out of the trade quickly, before the market sentiment changes. Be happy with a fifty- or sixty-pip gain.
Find range reversals and fade them for profits
You’ll be surprised at how often range reversal trading set-ups occur, yet you’ll need to use the appropriate complementary indicators to screen the signals and confirm your likelihood of success before entering a trade.
Also make sure to apply the principles carefully so your trading system is programmed to reject any trades signaled by the two exceptions to the rules mentioned again here:
Avoid the trade if the price’s average daily range has already been exceeded in the London session, and also reject any signal generated when volatility has reached high and low levels within a very short time.
With tight risk management and fine-tuning, your trading system can profitably trade range reversals on a regular basis, even under fairly volatile market conditions.