Trade of the Day: AUD/USD
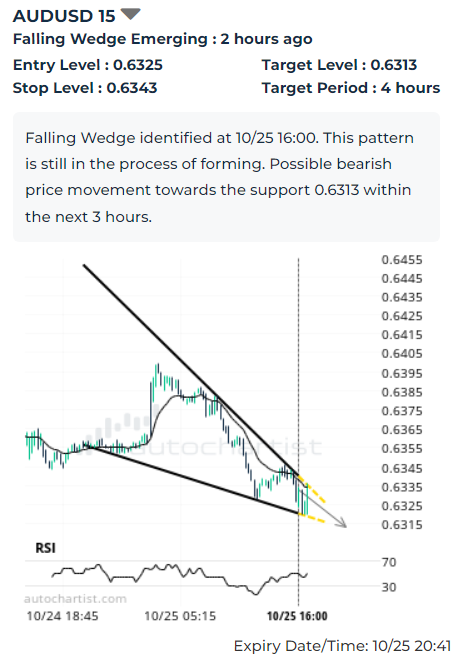
AUD/USD continues to fall inside the 15-minute Falling Wedge chart pattern, which was recently identified by Autochartist. The chart pattern indicates possible bearish price movement toward the target level 0.6313. The following are the optimal entry and stop-loss levels calculated by Autochartist: entry at 0.6325 with the protective stop-loss at 0.6443.
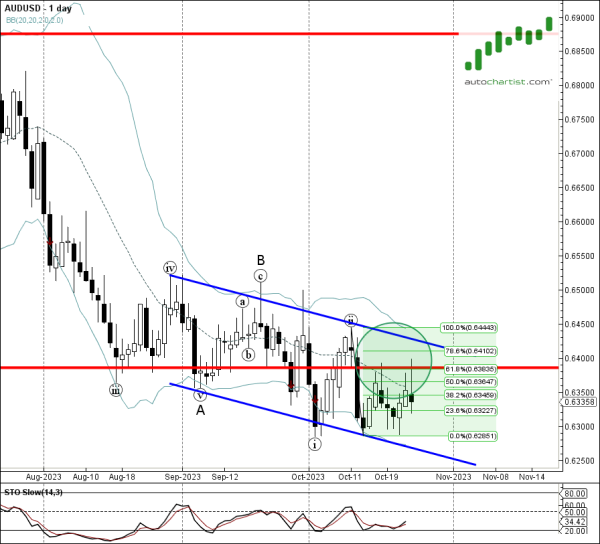
As can be seen from the daily AUD/USD chart below – the pair earlier reversed down from the key resistance level 0.6385 (which also reversed the pair earlier this month) standing near the 61.8% Fibonacci correction of the previous downward impulse from the start of October. The proximity of this resistance level and the clear daily downtrend increase the probability AUD/USD will continue to fall toward the target level 0.6313.