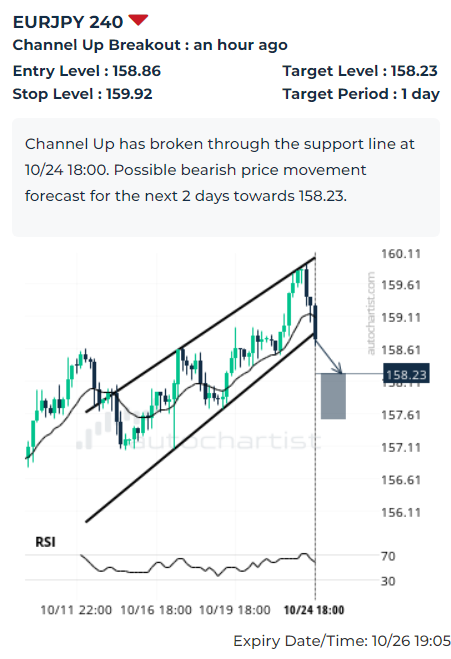
Trade of the Day: EUR/JPY
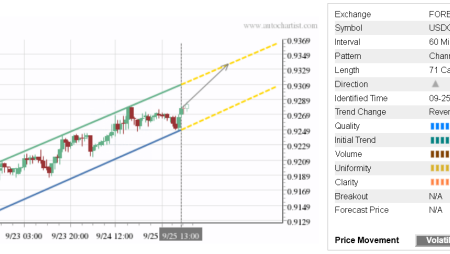
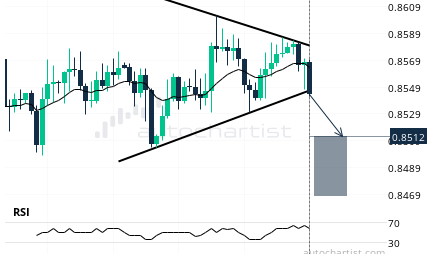
EUR/JPY today broke the 4-hour Up Channel chart pattern, which was recently identified by Autochartist. The pattern indicates possible bearish price movement toward the target level 158.230 in the next 3 days. The following are the optimal entry and stop-loss levels calculated by Autochartist for trading this chart pattern: entry at 158.86 with the protective stop-loss placed at 159.92. RSI reversing from the overbought territory confirms this bearish pattern.
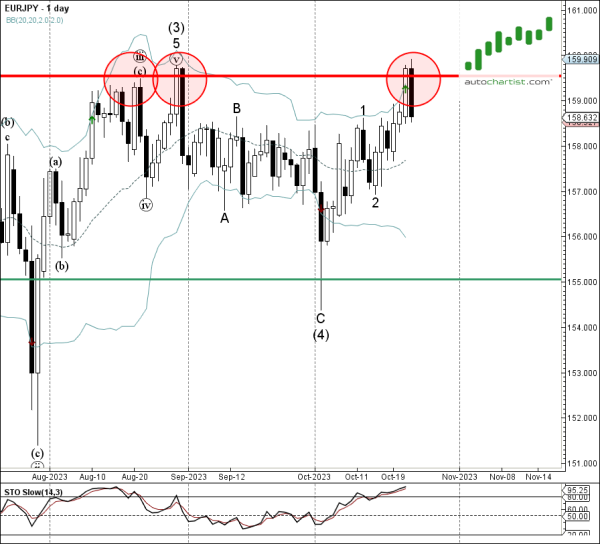
As can be seen from the daily EUR/JPY chart below – the pair earlier reversed down from the major resistance zone located between the key resistance level 159.50 (which has been reversing the price from August) and the upper daily Bollinger Band. The proximity of this resistance area and the overbought daily Stochastic increase the probability EUR/JPY will continue to fall toward the target level 158.230.