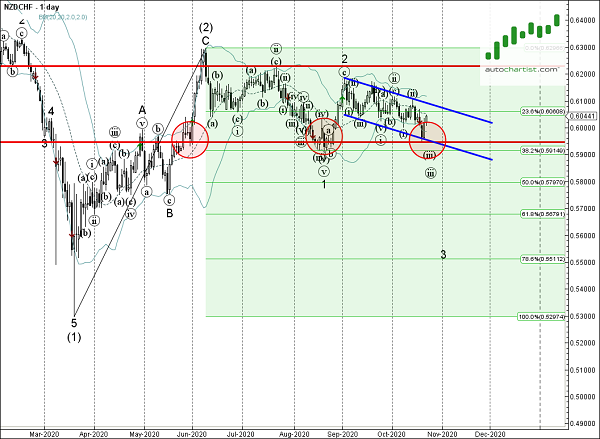
Trade of the Day: NZD/CHF
By: Dima Chernovolov
NZD/CHF recently broke the well-formed 4-hour Down Channel chart pattern, which was previously identified by Autochartist. Autochartist rates the quality of this Down Channel at the 7-bar level – which is the result of the slow Initial Trend (2 bars), significant Uniformity (7 bars) and maximum Clarity (10 bars). Autochartist also rates the strength of this breakout at the maximum 10-bar level– increasing the chances the pair will rise toward the forecast price 0.6072.
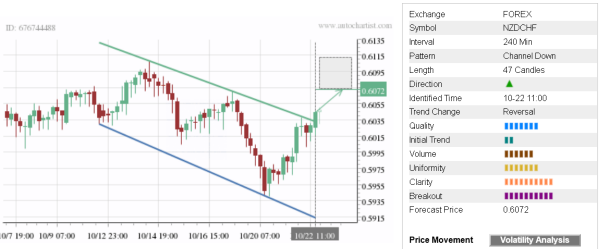
As can be seen from the daily NZD/CHF chart below, the bottom of this Down Channel formed near the strong support area located between the multi-month support level 0.5950, support trendline of the daily down channel from September and the 38.2% Fibonacci correction of the previous upward correction from March. The proximity of this support area increases the probability NZD/CHF will continue to rise toward the forecast price 0.6072.