Trade of the Day: GBP/USD
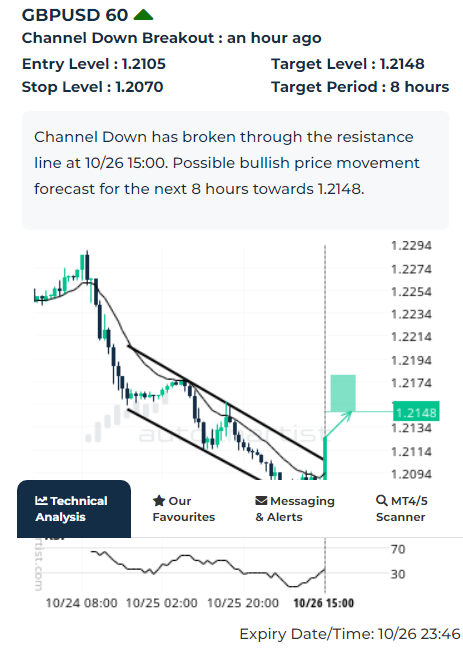
GBP/USD recently broke the hourly Down Channel chart pattern, which was previously identified by Autochartist. The chart pattern indicates possible bullish price movement toward the target level 1.2148. The following are the optimal entry and stop-loss levels calculated by Autochartist: entry at 1.2105 with the protective stop-loss at 1.2070.
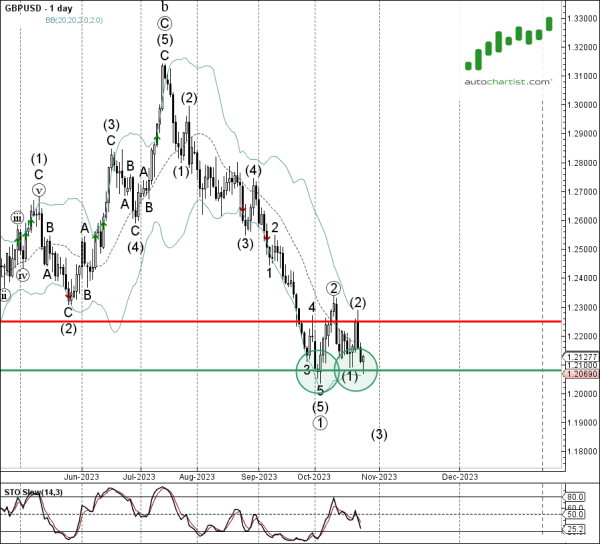
As can be seen from the daily GBP/USD chart below – the pair earlier reversed up from the key support level 1.2080 (which has been reversing the price from the start of October) standing near the lower daily Bollinger Band. The proximity of this support level increases the probability GBP/USD will continue to rise toward the target level 1.2148.