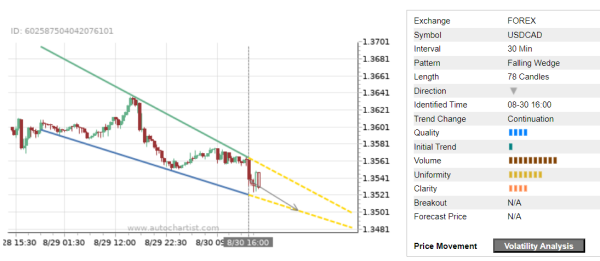
Trade of the Day: USD/CAD
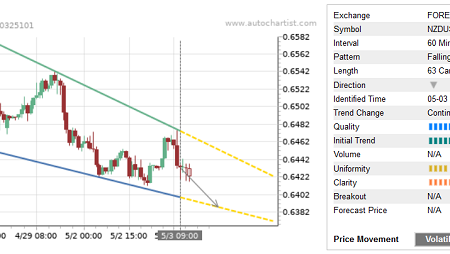
USD/CAD continues to fall inside the 30-minute Falling Wedge chart pattern, which was recently identified by Autochartist. Autochartist rates the quality of this Falling Wedge at the 4-bar level – which is the result of the slow Initial Trend (1 bar), significant Uniformity (7 bars) and lower Clarity (4 bars). USD/CAD is expected to fall further inside this Falling Wedge.
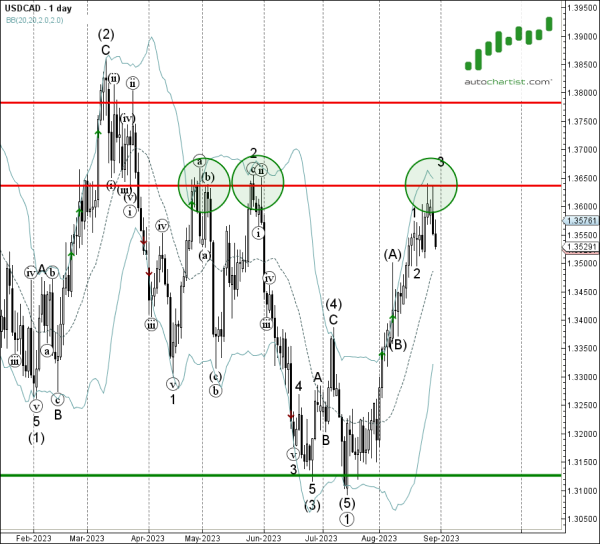
As can be seen from the daily USD/CAD chart below – the pair earlier reversed down from the resistance area located between the strong resistance level 1.3635 (which has been reversing the price from April) and the upper daily Bollinger Band. The proximity of this resistance area adds to the probability USD/CAD will continue to fall inside this Falling Wedge.