Trade of the Day: NZD/USD
By: Dima Chernovolov
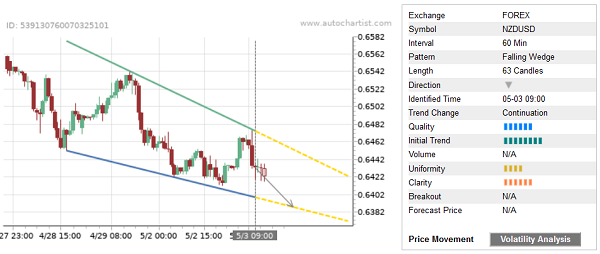
NZD/USD continues to fall inside the clear hourly Falling Wedge chart pattern, which was recently identified by Autochartist. Autochartist rates the quality of this Falling Wedge at the 6-bar level – which reflects the strong Initial Trend (8 bars), below-average Uniformity (4 bars) and higher Clarity (6 bars). NZD/USD is expected to fall further inside this Falling Wedge.
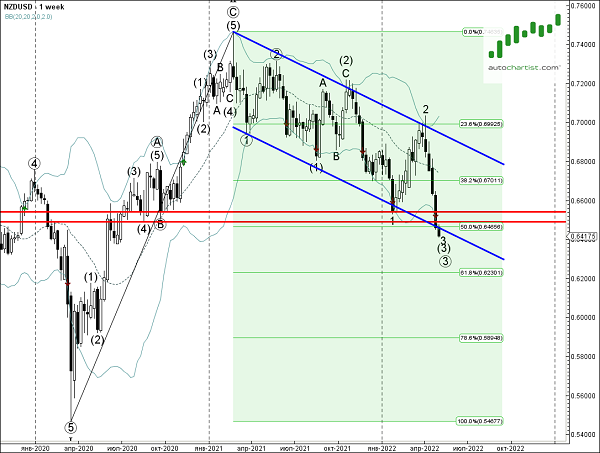
As can be seen from the weekly NZD/USD chart below – the price earlier broke the support area located between the strong support levels 0.6540 and 0.6490, as well as the support trendline of the weekly down-channel from the start of 2021. This price area is acting as the resistance zone after it was broken. The proximity of this resistance zone adds to the probability NZD/USD will continue to fall inside this Falling Wedge.