Daily Forex Update: USD/CAD
By: Dima Chernovolov
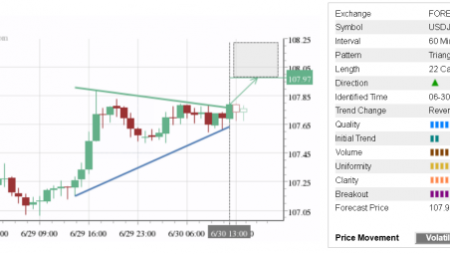
USD/CAD continues to fall inside the uniform Rising Wedge chart pattern which was previously identified by Autochartist on the 4-hour charts. Autochartist measures the Quality of this chart pattern at the 7-bar level – which is the result of the above Initial Trend (5 bars), substantial Uniformity (8 bars) and significant Clarity (7 bars). Higher uniformity reflects the even distribution of the connecting points of this chart pattern. USD/CAD is expected to fall toward the lower support trendline of this Rising Wedge (standing near 1.3130).

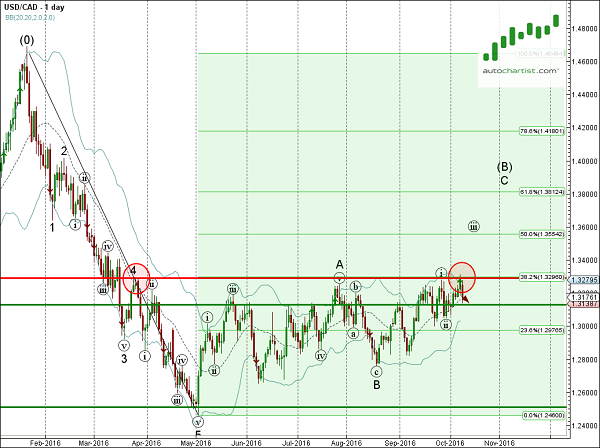
As you can see from the daily USD/CAD chart below, the top of this Rising Wedge formed when the pair reversed down from the resistance zone lying between the upper daily Bollinger Band, major resistance level 1.3290 and 38.2% Fibonacci correction of the previous sharp downward impulse from January. The proximity of this resistance zone adds to the likelihood USD/CAD will continue to fall inside this Rising Wedge.

To subscribe to the e-mail alerts feature is quick and easy. Log into the Autochartist platform, click on ‘Alerts & Messaging’, enter your email address, select the market you want covered, select your language, and the time you want to get your report, and you’re done! You will now receive a quick morning technical outlook of the markets.
For further information on this and other Autochartist products visit www.autochartist.com