Trade of the Day: USD/CAD
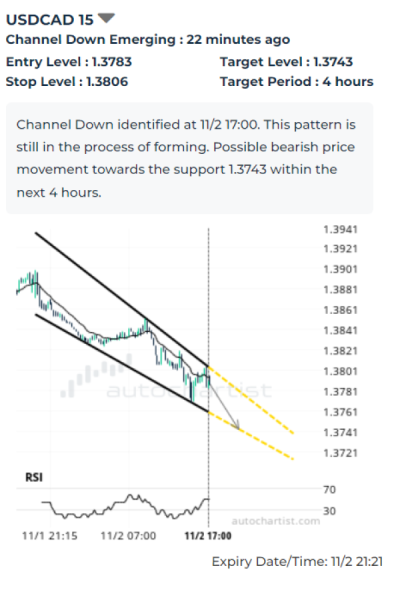
USD/CAD falling inside the 15-minute Down Channel chart pattern, which was recently identified by Autochartist. The chart pattern indicates possible bearish price movement toward the target level 1.3743. The following are the optimal entry and stop-loss levels calculated by Autochartist: entry at 1.3783 with the protective stop-loss at 1.3806.
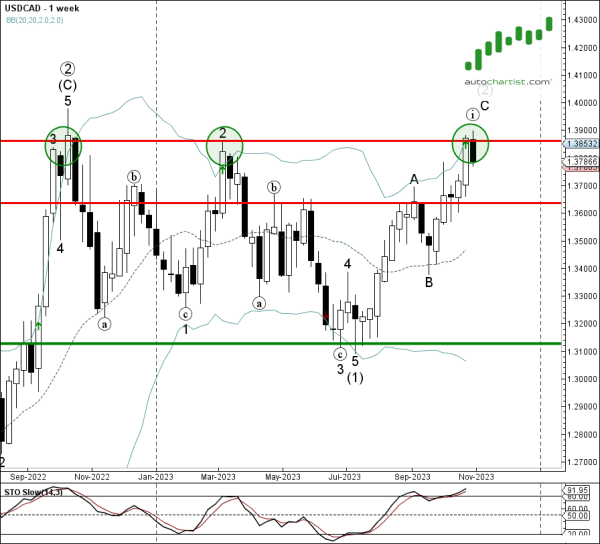
As can be seen from the daily USD/CAD chart below – the pair earlier reversed down from the long-term resistance level 1.3860 (which has been reversing the pair form 2022) intersecting with the upper weekly Bollinger Band. The proximity of this resistance level and the still overbought daily Stochastic increase the likelihood USD/CAD will continue to fall inside this Down Channel.