Trade of the Day: EUR/USD
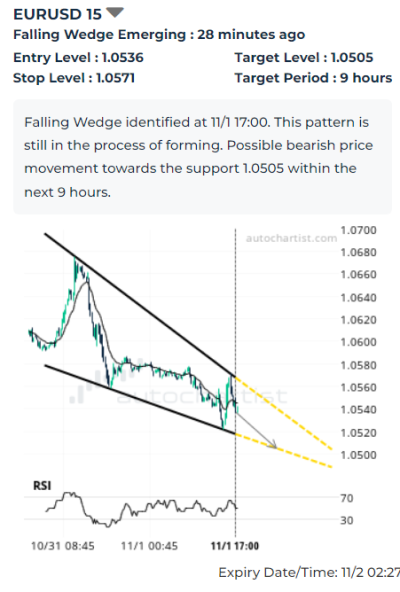
EUR/USD falling inside the 15-minute Falling Wedge chart pattern, which was recently identified by Autochartist. The chart pattern indicates possible bearish price movement toward the target level 1.0505. The following are the optimal entry and stop-loss levels calculated by Autochartist: entry at 1.0536 with the protective stop-loss at 1.0571.
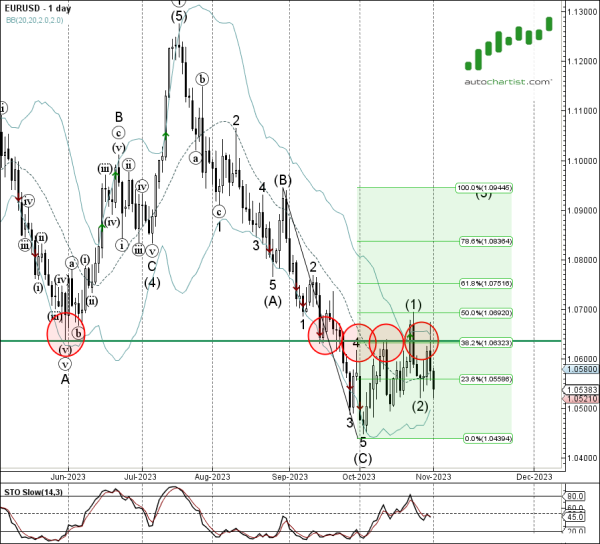
As can be seen from the daily EUR/USD chart below – the pair earlier reversed down from the key resistance level 1.0635 (former strong support from June and September) intersecting with the upper daily Bollinger Band and the 38.2% Fibonacci correction of the downward impulse from August. The proximity of this resistance level and the clear daily downtrend increase the likelihood EUR/USD will continue to fall toward the target level 1.0505.