Daily Forex Update: AUD/USD
By: Dima Chernovolov
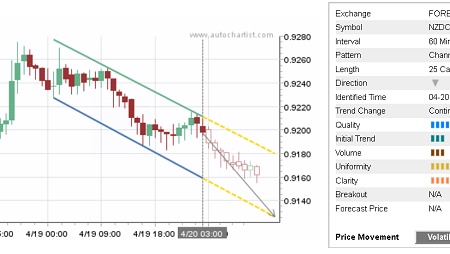
AUD/USD continues to fall inside the Clear Falling Wedge chart pattern which was previously identified by Autochartist on the 4-hours charts. Autochartist rates the Quality of this Falling Wedge at the 5 bar level – which is the result of the low Initial Trend (2 bars), average Uniformity (5 bars) and higher Clarity (7 bars). AUD/USD is expected to fall further inside this Falling Wedge – in line with the technical analysis shown on the second chart below.

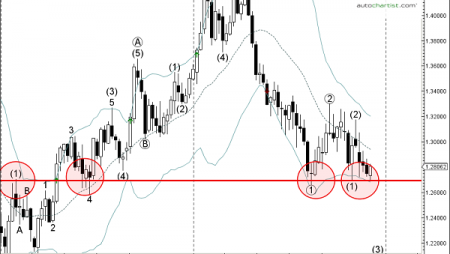
As can be seen from the daily AUD/USD chart below, this Falling Wedge follows the earlier downward reversal from the powerful resistance zone lying between the long-term resistance level 0.7740 (which has been repeatedly reversing the pair from August of 2016) and the upper daily Bollinger Band. Given the strength of the aforementioned resistance zone AUD/USD is expected to fall toward the lower support trendline of this Falling Wedge – intersecting with the key support level 0.7500 (monthly low from March).

To subscribe to the e-mail alerts feature is quick and easy. Log into the Autochartist platform, click on ‘Alerts & Messaging’, enter your email address, select the market you want covered, select your language, and the time you want to get your report, and you’re done! You will now receive a quick morning technical outlook of the markets.
For further information on this and other Autochartist products visit www.autochartist.com