Daily Forex Update: NZD/CAD
By: Dima Chernovolov
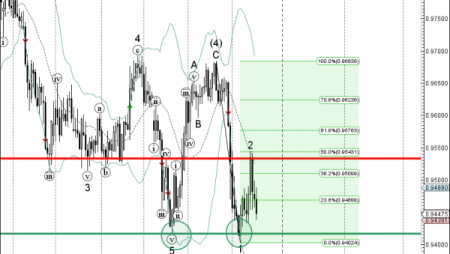
NZD/CAD continues to fall inside the hourly Down Channel chart pattern which was previously identified by Autochartist. Autochartist rates the quality of this Down Channel at the 8-bar level – which is the result of the low Initial Trend (3 bars), high Uniformity (8 bars) and maximum Clarity (10 bars). NZD/CAD is expected to fall further inside this Down Channel chart in line with the earlier breakout of the support zone shown below.

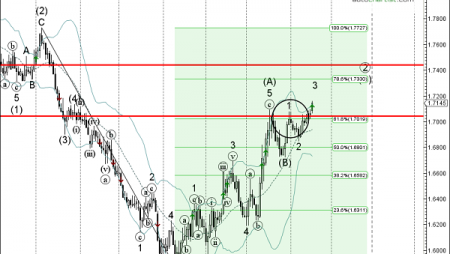
As can be seen from the daily NZD/CAD chart below, the price earlier broke through the support zone located between the support level 0.9210, support trendline of the daily up channel from December and the 61.8% Fibonacci correction of the upward impulse from February. This price zone is acting as resistance area after it was broken. The proximity of this resistance area increases the probability NZD/CAD will continue to fall inside this Down Channel.

To subscribe to the e-mail alerts feature is quick and easy. Log into the Autochartist platform, click on ‘Alerts & Messaging’, enter your email address, select the market you want covered, select your language, and the time you want to get your report, and you’re done! You will now receive a quick morning technical outlook of the markets.
For further information on this and other Autochartist products visit www.autochartist.com