Daily Forex Update: GBP/USD
By: Dima Chernovolov
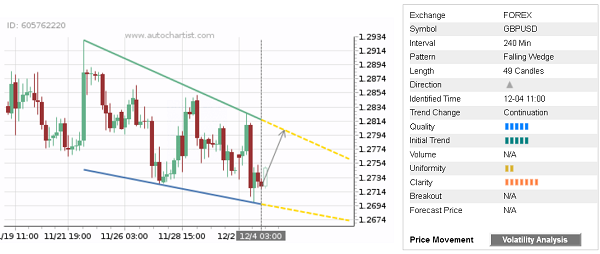
GBP/USD continues to rise after the earlier upward reversal from the support trendline of the 4-hour Falling Wedge chart pattern which was recently identified by Autochartist. Autochartist rates the quality of this Falling Wedge at the 5-bar level – which is the result of the medium Initial Trend (5 bars), lower Uniformity (2 bars) and significant Clarity (7 bars). GBP/USD is expected to rise inside this chart pattern – in line with the earlier upward reversal from the key support area shown below.
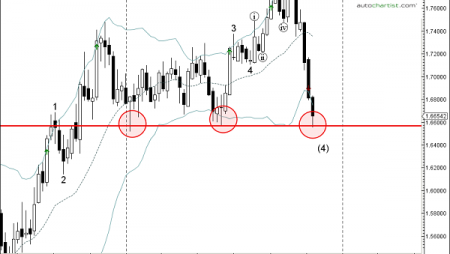
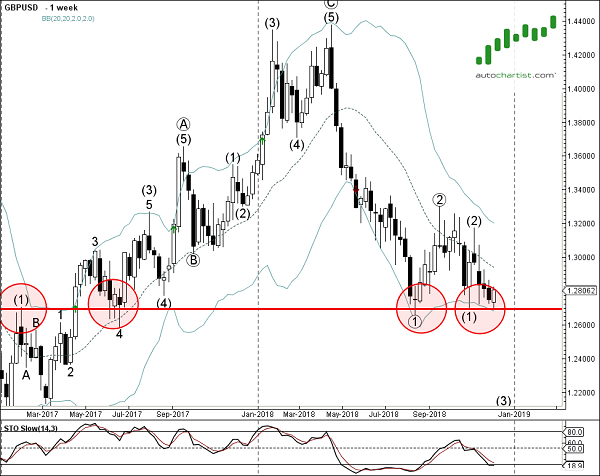
As can be seen from the weekly GBP/USD chart below, the bottom of this chart pattern formed when the price reversed up from the support area lying between the key support level 1.2690 (which has been reversing the price from the start of 2017) and the lower weekly Bollinger Band. The proximity of this support zone and the oversold reading on the weekly Stochastic increases the probability GBP/USD will continue to rise inside this Falling Wedge.
To subscribe to the e-mail alerts feature is quick and easy. Log into the Autochartist platform, click on ‘Alerts & Messaging’, enter your email address, select the market you want covered, select your language, and the time you want to get your report, and you’re done! You will now receive a quick morning technical outlook of the markets.
For further information on this and other Autochartist products visit www.autochartist.com