Help & Documentation
  • Home
  • Sign In
  • Contact Us
  • Home
  • Sign In
  • Contact Us

US T-Bond up to 185.3750

/Futures Technical Analysis - TD/US T-Bond up to 185.3750

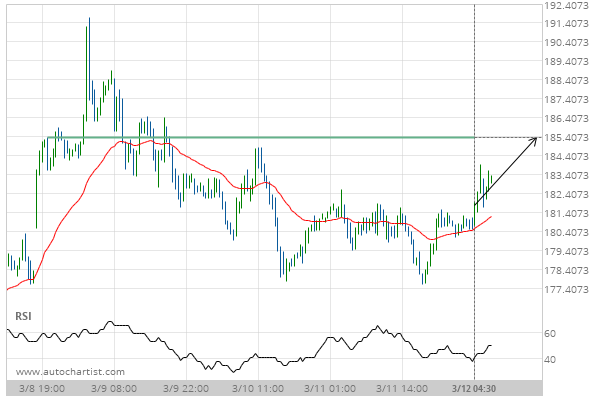
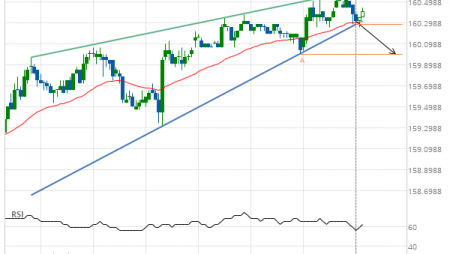
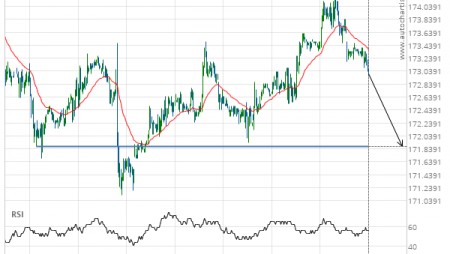
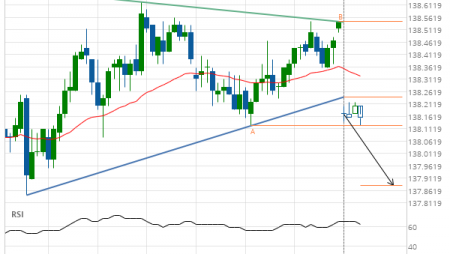
US T-Bond up to 185.3750

Posted on March 12, 2020 by admin wrote in Futures Technical Analysis - TD.

Approaching Resistance level of 185.3750 identified at 12-Mar-2020 04:30 EDT

Tags: ZB
0 Likes
203 Views

You may also like

Lean Hogs down to 59.6500
February 7, 2019
US T-Bond down to 154.5313
June 26, 2019
Silver Front Month down to 22.9350
November 27, 2020

Comments are closed.

Silver Front Month down to 16.2770 Wal-Mart Stores (WMT) excessive bearish movement

Futures Technical Analysis – TD

US T-Bond up to 169.4625

January 25, 2021 11:18 am | By admin

Broke through Resistance level of 169.0313 at 25-Jan-2021 04:45 EST Read more →

Soybean Meal up to 447.0000

January 25, 2021 11:17 am | By admin

Channel Down identified at 25-Jan-2021 03:00 EST. This pattern is... Read more →

Gold Front Month up to 1874.6000

January 25, 2021 11:17 am | By admin

Rising Wedge identified at 24-Jan-2021 20:00 EST. This pattern is... Read more →

10 year T-Note up to 137.0781

January 25, 2021 11:17 am | By admin

Ascending Triangle identified at 25-Jan-2021 05:00 EST. This pattern is... Read more →

Soybeans up to 1387.0000

January 25, 2021 11:17 am | By admin

Channel Down identified at 25-Jan-2021 04:00 EST. This pattern is... Read more →

  • About Us
  • Privacy Policy
  • Disclaimer
  • Terms and Conditions
  • Get started for FREE
  • Contact Us
Copyright © 2020 Autochartist.com. All rights reserved.
This site uses cookies: Find out more.