Help & Documentation
  • Home
  • Sign In
  • Contact Us
  • Home
  • Sign In
  • Contact Us

10 year T-Note down to 137.8817

/Futures Technical Analysis - TD/10 year T-Note down to 137.8817

10 year T-Note down to 137.8817

Posted on November 30, 2020 by Autochartist wrote in Futures Technical Analysis - TD.

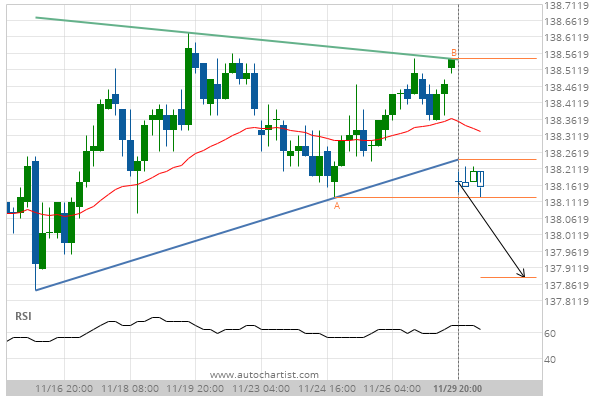
Triangle has broken through the support line at 29-Nov-2020 20:00 EST. Possible bearish price movement forecast for the next 3 days towards 137.8817.

Tags: CBOT-GBX, ZN
0 Likes
469 Views

You may also like

Gold Front Month up to 1262.2000
December 20, 2018
CORN DECEMBER 2020 down to 351.0000
September 1, 2020
Soybeans up to 1159.5000
November 12, 2020

Comments are closed.

WALT DISNEY (DIS) excessive bearish movement CORN MARCH 2021 up to 444.9069

Futures Technical Analysis – TD

Light Sweet Crude Oil Front Month up to 67.9800

March 9, 2021 11:17 am | By Autochartist

Rising Wedge identified at 09-Mar-2021 05:00 EST. This pattern is... Read more →

Feeder Cattle Front Month down to 137.2250

March 9, 2021 11:17 am | By Autochartist

Channel Down identified at 08-Mar-2021 14:00 EST. This pattern is... Read more →

Soybean Oil up to 53.2300

March 9, 2021 11:17 am | By Autochartist

Channel Up identified at 09-Mar-2021 04:30 EST. This pattern is... Read more →

Silver Front Month up to 26.5600

March 9, 2021 11:17 am | By Autochartist

Approaching Resistance level of 26.5600 identified at 09-Mar-2021 04:00 EST Read more →

10 year T-Note up to 133.1644

March 9, 2021 11:17 am | By Autochartist

Falling Wedge has broken through the resistance line at 09-Mar-2021... Read more →

  • About Us
  • Privacy Policy
  • Disclaimer
  • Terms and Conditions
  • Get started for FREE
  • Contact Us
Copyright © 2022 Autochartist.com. All rights reserved.
This site uses cookies: Find out more.