Help & Documentation
  • Home
  • Sign In
  • Contact Us
  • Home
  • Sign In
  • Contact Us

CORN MARCH 2021 up to 444.9069

/Futures Technical Analysis - TD/CORN MARCH 2021 up to 444.9069

CORN MARCH 2021 up to 444.9069

Posted on November 30, 2020 by Autochartist wrote in Futures Technical Analysis - TD.

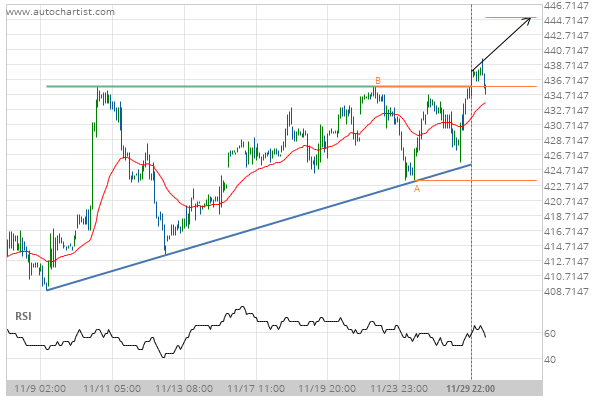
Ascending Triangle has broken through the resistance line at 29-Nov-2020 22:00 EST. Possible bullish price movement forecast for the next 3 days towards 444.9069.

Tags: CBOT, ZC
0 Likes
367 Views

You may also like

KC HRW Wheat down to 419.2500
October 16, 2019
Gold Front Month up to 1939.4000
October 16, 2020
Gold Front Month up to 1768.0000
April 24, 2020

Comments are closed.

10 year T-Note down to 137.8817 Soybean Oil down to 37.2500

Futures Technical Analysis – TD

Light Sweet Crude Oil Front Month up to 67.9800

March 9, 2021 11:17 am | By Autochartist

Rising Wedge identified at 09-Mar-2021 05:00 EST. This pattern is... Read more →

Feeder Cattle Front Month down to 137.2250

March 9, 2021 11:17 am | By Autochartist

Channel Down identified at 08-Mar-2021 14:00 EST. This pattern is... Read more →

Soybean Oil up to 53.2300

March 9, 2021 11:17 am | By Autochartist

Channel Up identified at 09-Mar-2021 04:30 EST. This pattern is... Read more →

Silver Front Month up to 26.5600

March 9, 2021 11:17 am | By Autochartist

Approaching Resistance level of 26.5600 identified at 09-Mar-2021 04:00 EST Read more →

10 year T-Note up to 133.1644

March 9, 2021 11:17 am | By Autochartist

Falling Wedge has broken through the resistance line at 09-Mar-2021... Read more →

  • About Us
  • Privacy Policy
  • Disclaimer
  • Terms and Conditions
  • Get started for FREE
  • Contact Us
Copyright © 2022 Autochartist.com. All rights reserved.
This site uses cookies: Find out more.