US T-Bond down to 160.0000
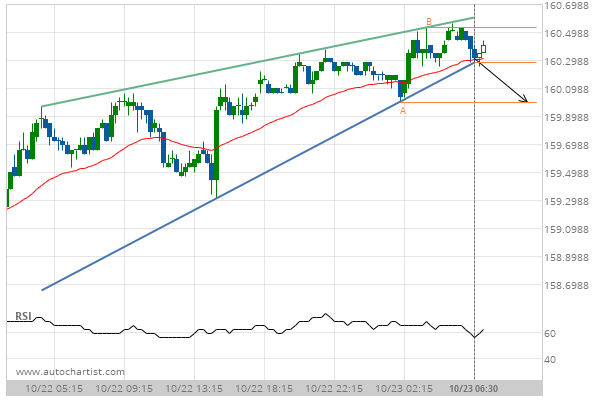
Rising Wedge identified at 23-Oct-2019 06:30 EDT. This pattern is still in the process of forming. Possible bearish price movement towards the support 160.0000 within the next 8 hours.
Rising Wedge identified at 23-Oct-2019 06:30 EDT. This pattern is still in the process of forming. Possible bearish price movement towards the support 160.0000 within the next 8 hours.