Help & Documentation
  • Home
  • Sign In
  • Contact Us
  • Home
  • Sign In
  • Contact Us

US T-Bond down to 168.0313

/Futures Technical Analysis - TD/US T-Bond down to 168.0313

US T-Bond down to 168.0313

Posted on January 18, 2021 by Autochartist wrote in Futures Technical Analysis - TD.

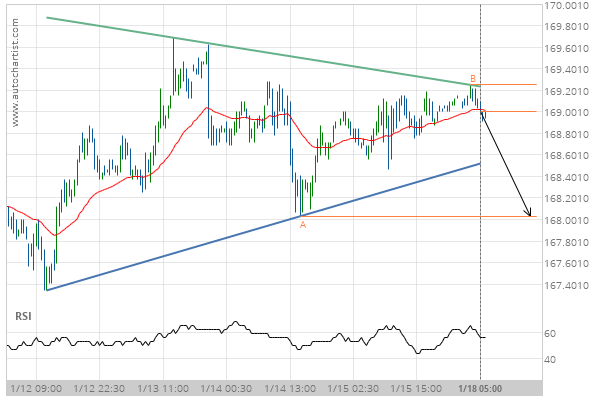
Triangle identified at 18-Jan-2021 05:00 EST. This pattern is still in the process of forming. Possible bearish price movement towards the support 168.0313 within the next day.

Tags: CBOT-GBX, ZB
0 Likes
221 Views

You may also like

Corn down to 385.7500
January 6, 2020
Gold Front Month down to 1513.7000
December 30, 2019
Corn down to 322.0000
July 23, 2020

Comments are closed.

Corn down to 524.1489 Gold Front Month down to 1800.8000

Futures Technical Analysis – TD

Light Sweet Crude Oil Front Month up to 67.9800

March 9, 2021 11:17 am | By Autochartist

Rising Wedge identified at 09-Mar-2021 05:00 EST. This pattern is... Read more →

Feeder Cattle Front Month down to 137.2250

March 9, 2021 11:17 am | By Autochartist

Channel Down identified at 08-Mar-2021 14:00 EST. This pattern is... Read more →

Soybean Oil up to 53.2300

March 9, 2021 11:17 am | By Autochartist

Channel Up identified at 09-Mar-2021 04:30 EST. This pattern is... Read more →

Silver Front Month up to 26.5600

March 9, 2021 11:17 am | By Autochartist

Approaching Resistance level of 26.5600 identified at 09-Mar-2021 04:00 EST Read more →

10 year T-Note up to 133.1644

March 9, 2021 11:17 am | By Autochartist

Falling Wedge has broken through the resistance line at 09-Mar-2021... Read more →

  • About Us
  • Privacy Policy
  • Disclaimer
  • Terms and Conditions
  • Get started for FREE
  • Contact Us
Copyright © 2020 Autochartist.com. All rights reserved.
This site uses cookies: Find out more.