Help & Documentation
  • Home
  • Sign In
  • Contact Us
  • Home
  • Sign In
  • Contact Us

Corn down to 524.1489

/Futures Technical Analysis - TD/Corn down to 524.1489

Corn down to 524.1489

Posted on January 18, 2021 by Autochartist wrote in Futures Technical Analysis - TD.

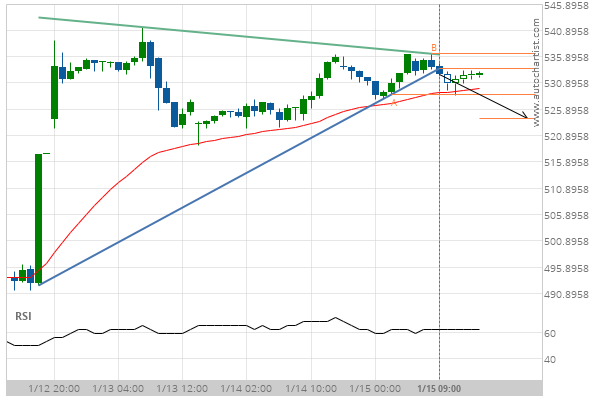
Triangle has broken through the support line at 15-Jan-2021 09:00 EST. Possible bearish price movement forecast for the next 12 hours towards 524.1489.

Tags: CBOT, ZC
0 Likes
245 Views

You may also like

CORN JULY 2019 up to 371.7500
May 8, 2019
E-mini S&P 500 up to 2523.0000
January 4, 2019
Light Sweet Crude Oil Front Month down to 45.1300
December 24, 2018

Comments are closed.

Jpmorgan Chase & Co. (JPM) down to 136.77 US T-Bond down to 168.0313

Futures Technical Analysis – TD

Light Sweet Crude Oil Front Month up to 67.9800

March 9, 2021 11:17 am | By Autochartist

Rising Wedge identified at 09-Mar-2021 05:00 EST. This pattern is... Read more →

Feeder Cattle Front Month down to 137.2250

March 9, 2021 11:17 am | By Autochartist

Channel Down identified at 08-Mar-2021 14:00 EST. This pattern is... Read more →

Soybean Oil up to 53.2300

March 9, 2021 11:17 am | By Autochartist

Channel Up identified at 09-Mar-2021 04:30 EST. This pattern is... Read more →

Silver Front Month up to 26.5600

March 9, 2021 11:17 am | By Autochartist

Approaching Resistance level of 26.5600 identified at 09-Mar-2021 04:00 EST Read more →

10 year T-Note up to 133.1644

March 9, 2021 11:17 am | By Autochartist

Falling Wedge has broken through the resistance line at 09-Mar-2021... Read more →

  • About Us
  • Privacy Policy
  • Disclaimer
  • Terms and Conditions
  • Get started for FREE
  • Contact Us
Copyright © 2020 Autochartist.com. All rights reserved.
This site uses cookies: Find out more.