Help & Documentation
  • Home
  • Sign In
  • Contact Us
  • Home
  • Sign In
  • Contact Us

Lean Hogs down to 61.9525

/Futures Technical Analysis - TD/Lean Hogs down to 61.9525

Lean Hogs down to 61.9525

Posted on September 22, 2020 by Autochartist wrote in Futures Technical Analysis - TD.

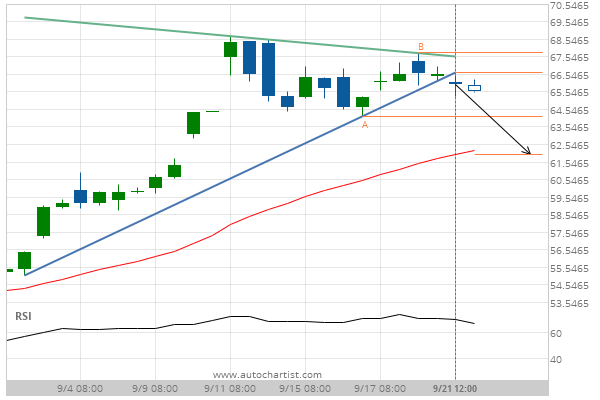
Triangle has broken through the support line at 21-Sep-2020 12:00 EDT. Possible bearish price movement forecast for the next day towards 61.9525.

Tags: CME, HE
0 Likes
401 Views

You may also like

Lean Hogs up to 72.4100
December 31, 2019
E-mini S&P 500 down to 2729.0000
February 19, 2019
Soybeans up to 875.7500
June 19, 2020

Comments are closed.

KC HRW Wheat excessive bearish movement Corn up to 372.7500

Futures Technical Analysis – TD

Light Sweet Crude Oil Front Month up to 67.9800

March 9, 2021 11:17 am | By Autochartist

Rising Wedge identified at 09-Mar-2021 05:00 EST. This pattern is... Read more →

Feeder Cattle Front Month down to 137.2250

March 9, 2021 11:17 am | By Autochartist

Channel Down identified at 08-Mar-2021 14:00 EST. This pattern is... Read more →

Soybean Oil up to 53.2300

March 9, 2021 11:17 am | By Autochartist

Channel Up identified at 09-Mar-2021 04:30 EST. This pattern is... Read more →

Silver Front Month up to 26.5600

March 9, 2021 11:17 am | By Autochartist

Approaching Resistance level of 26.5600 identified at 09-Mar-2021 04:00 EST Read more →

10 year T-Note up to 133.1644

March 9, 2021 11:17 am | By Autochartist

Falling Wedge has broken through the resistance line at 09-Mar-2021... Read more →

  • About Us
  • Privacy Policy
  • Disclaimer
  • Terms and Conditions
  • Get started for FREE
  • Contact Us
Copyright © 2022 Autochartist.com. All rights reserved.
This site uses cookies: Find out more.