Trade of the Day: USD/CAD
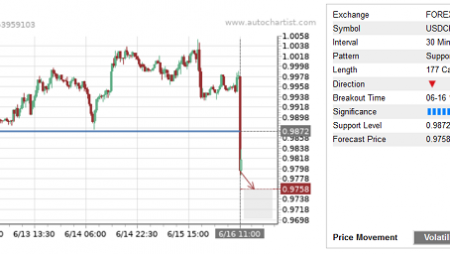
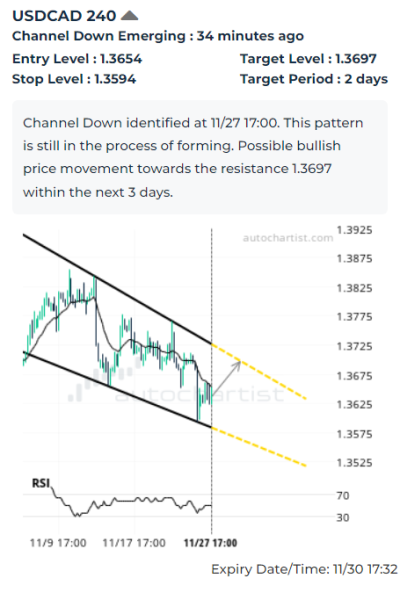
USD/CAD continues to rise inside the 4-hour Down Channel chart pattern, which was recently identified by Autochartist. The chart pattern indicates possible bu9llish price movement toward the target level 1.3697. The following are the optimal entry and stop-loss levels calculated by Autochartist: entry at 1.3654 with the protective stop-loss at 1.3594.
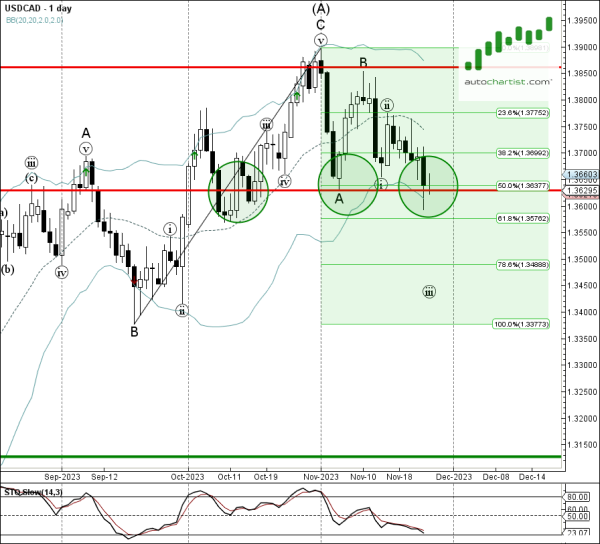
As can be seen from the daily USD/CAD chart below – the pair earlier reversed up from the key support level 1.3630 (which has been reversing the price from October) strengthened by the lower daily Bollinger Band and the 50% Fibonacci correction of the upward impulse from September. The proximity of these support levels and the clear daily uptrend increase the probability USD/CAD will continue to rise toward the target level 1.3697.