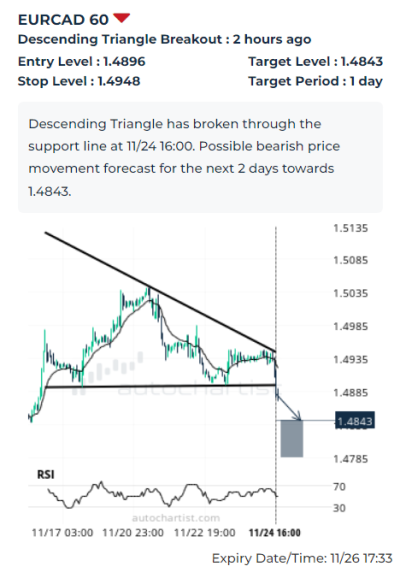
Trade of the Day: EUR/CAD
EUR/CAD recently broke the hourly Descending Triangle chart pattern, which was recently identified by Autochartist. The chart pattern indicates possible bearish price movement toward the target level 1.4843 The following are the optimal entry and stop-loss levels calculated by Autochartist: entry at 1.4896 with the protective stop-loss at 1.4948.
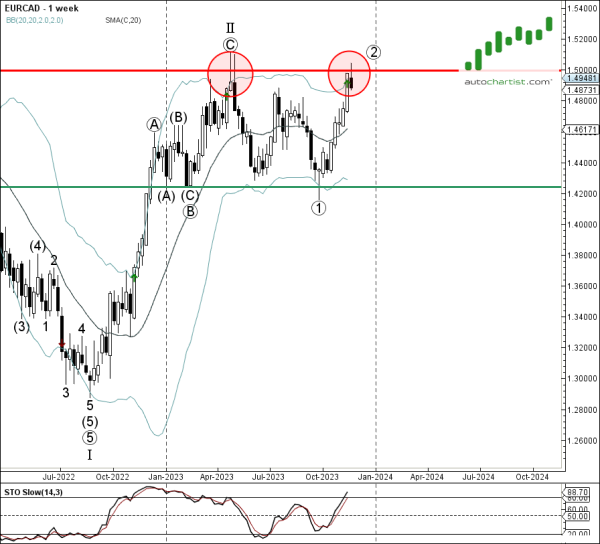
As can be seen from the weekly EUR/CAD chart below – the pair earlier reversed down from the major round resistance level 1.5000 (which formed the weekly Shooting Star at the start of this year) strengthened by the upper weekly Bollinger Band. The proximity of these resistance levels and the overbought weekly Stochastic increase the probability EUR/CAD will continue to fall toward the target level 1.4843.