Trade of the Day: EUR/JPY
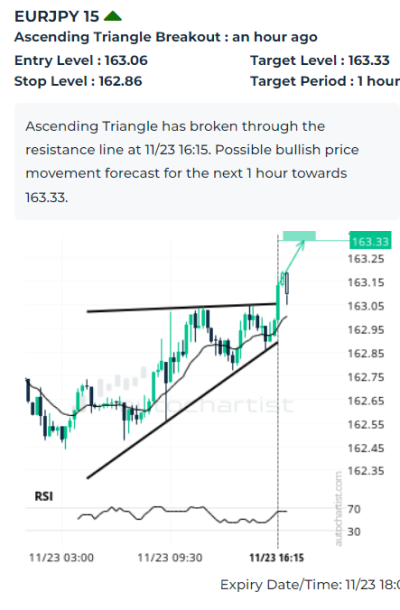
EUR/JPY recently broke the 15-minute Ascending Triangle chart pattern, which was recently identified by Autochartist. The chart pattern indicates possible bullish price movement toward the target level 163.33. The following are the optimal entry and stop-loss levels calculated by Autochartist: entry at 163.03 with the protective stop-loss at 162.86.
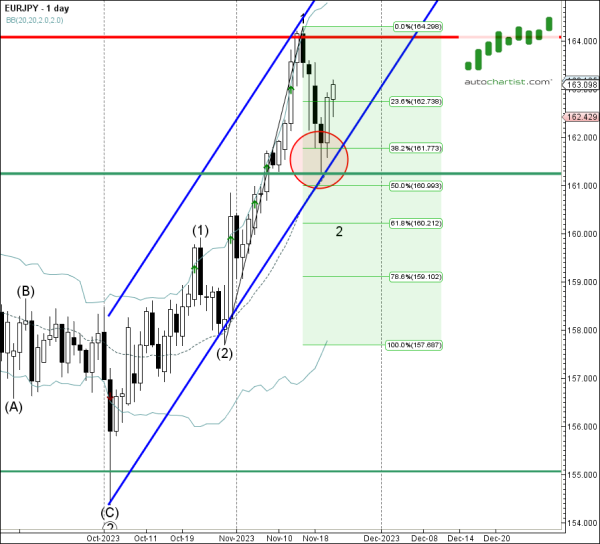
As can be seen from the daily EUR/JPY chart below – the pair earlier reversed up from the key support level 161.25 (which also reversed the pair at the start of this month) intersecting with the 20-day moving average, support trendline of the daily up channel from October and 50 % Fibonacci correction of the upward impulse from October. The proximity of these support levels and the clear daily uptrend increase the probability EUR/JPY will continue to rise toward the target level 163.33.