Trade of the Day: GBP/CAD
By: Dima Chernovolov
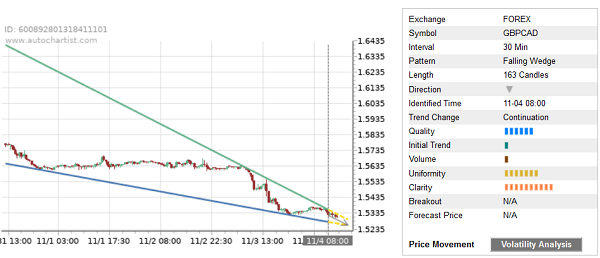
GBP/CAD falling inside the 30-minute Falling Wedge chart pattern, which was recently identified by Autochartist. Autochartist rates the quality of this Falling Wedge at the 7-bar level – which is the result of the slow Initial Trend (1 bar), significant Uniformity (7 bars) and maximum Clarity (10 bars). GBP/CAD is expected to fall further inside this Falling Wedge.
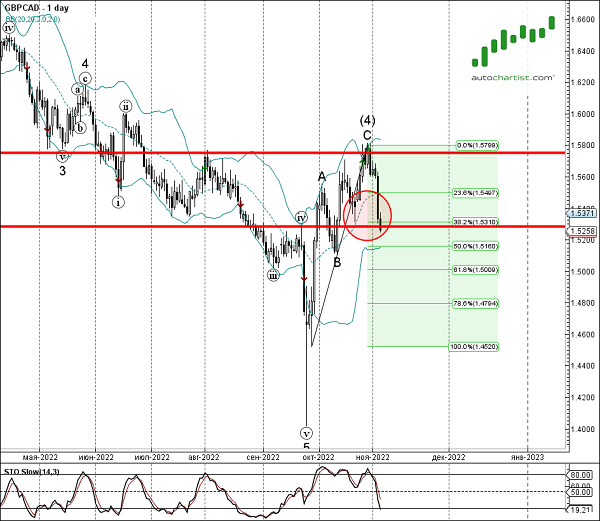
As can be seen from the daily GBP/CAD chart below – the pair earlier broke through the support area lying between the support level 1.5285 and the 38.2% Fibonacci correction of the upward impulse from September. This price area is acting as the resistance zone now. The proximity of resistance area and the clear daily downtrend adds to the probability GBP/CAD will continue to fall inside Falling Wedge.