Trade of the Day: USD/CAD
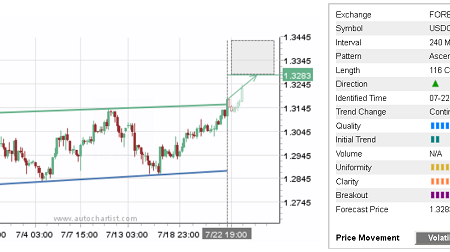
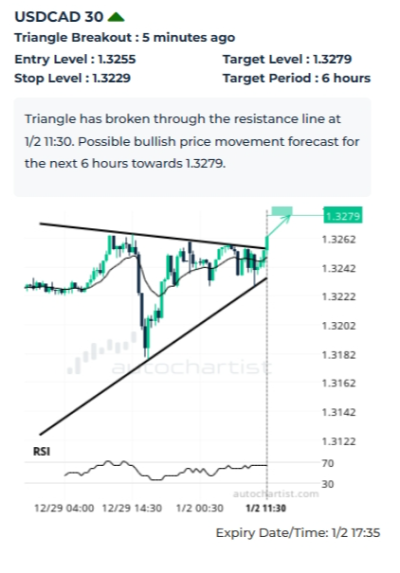
USD/CAD recently broke the 30-minute Triangle chart pattern, which was recently identified by Autochartist. This chart pattern indicates possible bullish price movement toward the target level 1.3279. The following are the optimal entry and stop-loss levels calculated by Autochartist: entry 1.3255 with the protective stop-loss at 1.3229.
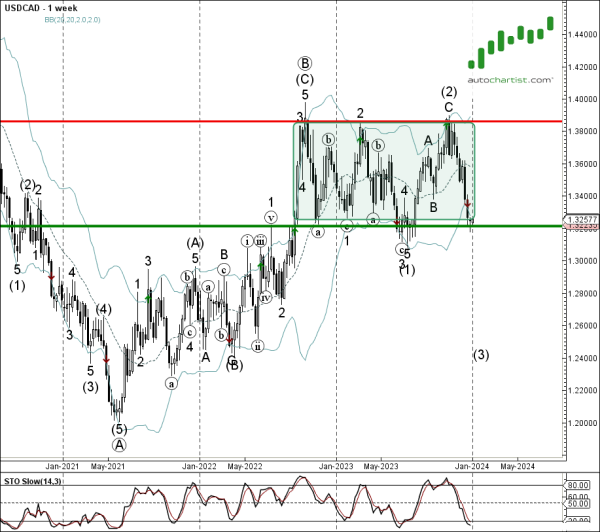
As can be seen from the daily USD/CAD chart below – the pair earlier reversed up from the key support level 1.3210 (which is the lower boundary of the wide weekly sideways price range inside which the pair has been trading from 2022), standing near the lower weekly Bollinger Band. Given the proximity of the support level 1.3210 and the oversold weekly Stochastic, USD/CAD can be expected rise to the target level 1.3279.