Trade of the Day: GBP/AUD
By: Dima Chernovolov
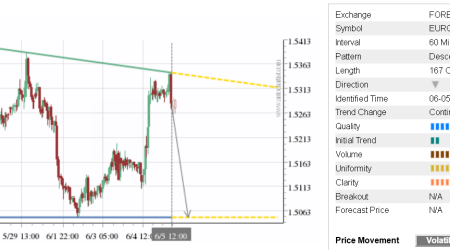
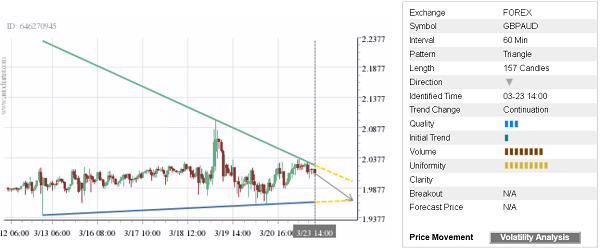
GBP/AUD continues to fall inside the hourly Triangle chart pattern which was previously identified by Autochartist. Autochartist rates the quality of this Triangle at the 3-bar level – which reflects the slow Initial Trend (1 bar) and strong Uniformity (8 bars). GBP/AUD is expected to fall further inside this Triangle – in line with the earlier downward reversal from the powerful resistance area highlighted below.
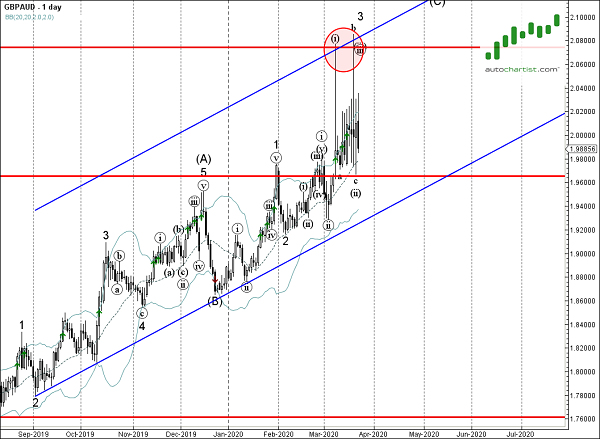
As can be seen from the daily GBP/AUD chart below – the price earlier reversed down from the daily resistance area located between the pivotal resistance levels 2.0740 (top of the previous weekly Shooting Star), upper daily Bollinger Band and the resistance trendline of the weekly up channel from September. The proximity of this resistance area increases the probability GBP/AUD will continue to fall inside this Triangle.