Trade of the Day: USD/CHF
By: Dima Chernovolov
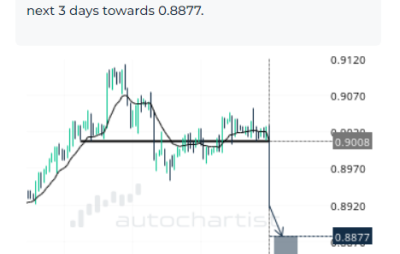
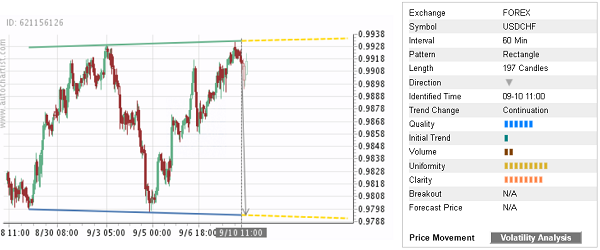
USD/CHF continues to fall inside the hourly Rectangle chart pattern which was identified previously by Autochartist. Autochartist rates the quality of this Rectangle at the 6-bar level – which reflects the slow Initial Trend (1 bar), strong Uniformity (9 bars) and substantial Clarity (8 bars). USD/CHF is expected to fall further inside this Rectangle – in line with the earlier downward reversal from the resistance area shown below.
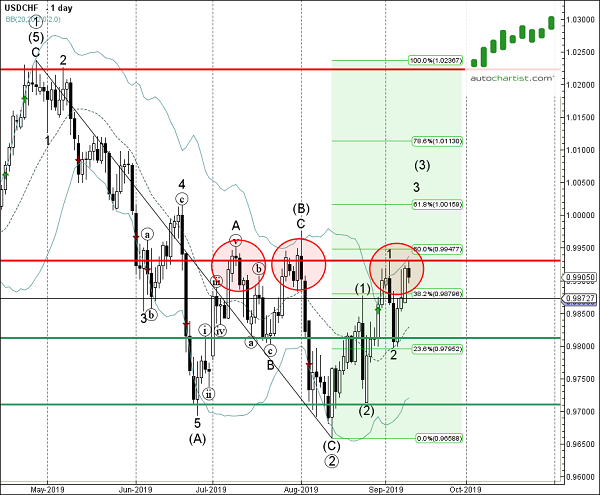
As can be seen from the daily USD/CHF chart below, the price earlier reversed down from the resistance area lying between the resistance level 0.9930, upper daily Bollinger Band and the 50% Fibonacci correction of the previous downward impulse from April. The proximity of this resistance area increases the probability USD/CHF will continue to fall inside this Rectangle.