The USDCAD has experienced a bullish breakout from a triangle pattern through resistance. The projected target is set at 1.3728.
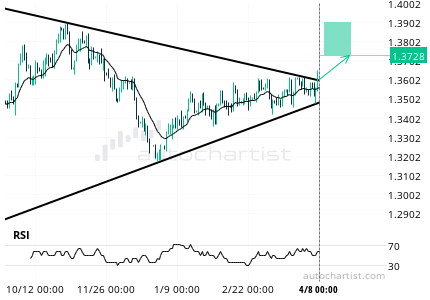
The trading setup for USDCAD was recognized and it appears that the price of USDCAD has breached the resistance line of a Triangle pattern on April 8, 2024, at midnight. This could potentially indicate a bullish price movement towards 1.3728 over the next 43 days.
However, the quality of this pattern is not very high, and the breakout through the resistance line was not strong. It might be prudent to wait for additional confirmation of this breakout before initiating a position.
It’s important to note that the USDCAD price could experience high volatility during economic events that occur within the forecast period. Particularly, these events have historically caused significant fluctuations in the volatility of USDCAD:
– United States Inflation Rate Year on Year, United States Inflation Rate Month on Month, United States Core Inflation Rate Year on Year, United States Core Inflation Rate Month on Month, all scheduled for April 10 at 12:30 (UTC).