The NZDUSD pair has experienced a bullish breakout through the downward channel’s resistance. The target is set at 0.6106.
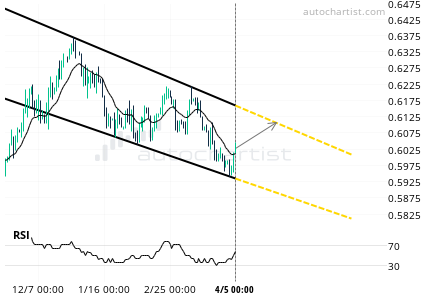
A trading opportunity was spotted on the NZDUSD pair. The NZDUSD price breached the resistance line of a descending channel pattern on 5th April 2024 at midnight. An anticipated bullish trend might push the price towards 0.6106 in the next 27 days.
The pattern’s visual quality is impressive. The initial price trend before this pattern formation was robust. The trade setup is well-defined, with minimal noise during the price oscillations between support and resistance levels. The resistance breakout, however, was not strong. It might be wise to wait for additional validation of this breakout before initiating a trade.
Please note that NZDUSD’s price can be highly volatile during specific economic events within the forecast period. Particularly, the following events have historically caused significant fluctuations in NZDUSD’s volatility:
– On 5th April at 12:30 (UTC): Canada’s Unemployment Rate, US Non-Farm Payrolls, and US Unemployment Rate
– On 10th April at 12:30 (UTC): US Year-on-Year and Month-on-Month Inflation Rate, and US Core Inflation Rate Year-on-Year and Month-on-Month
– On 11th April at 12:15 (UTC): Euro Area’s ECB Interest Rate Decision and Deposit Facility Rate.