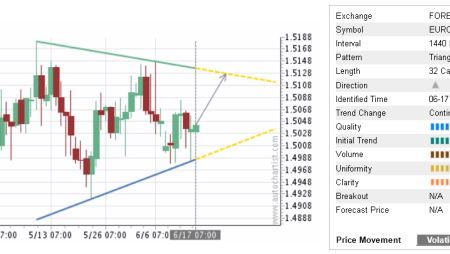
The USDCAD is experiencing a bullish breakout through resistance, forming an ascending triangle. The target is set at 1.3571.

The trading arrangement was spotted on USDCAD. The USDCAD’s price has surpassed the resistance line of an Ascending Triangle pattern on 26th February 2024 at midnight. It’s predicted that there might be a bullish price movement towards 1.3571 for the subsequent 19 days.
The overall visual representation of this pattern isn’t very clear. The initial price trend before this trading arrangement was formed appears to be quite weak, suggesting a turbulent market. The breach through resistance was also weak. It might be advisable to wait for additional confirmation of this breakout before initiating a trade.
There don’t seem to be any economic events scheduled during the forecast period that have traditionally influenced the volatility of USDCAD.