Help & Documentation
  • Home
  • Sign In
  • Contact Us
  • Home
  • Sign In
  • Contact Us

KC HRW Wheat excessive bearish movement

/Futures Statistical Analysis - TD/KC HRW Wheat excessive bearish movement

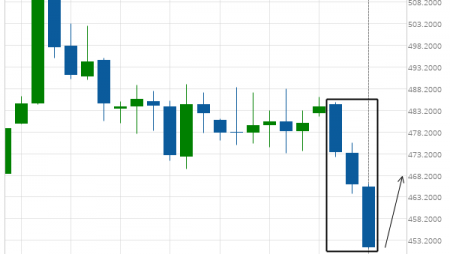
KC HRW Wheat excessive bearish movement

Posted on July 8, 2019 by Autochartist wrote in Futures Statistical Analysis - TD.

KC HRW Wheat experienced a 8.1% bearish movement in the last 9 days.

Tags: Big Movement, KE
0 Likes
626 Views

You may also like

Silver Front Month excessive bearish movement
August 12, 2020
Gold Front Month excessive bearish movement
March 8, 2019
Soybean Meal excessive bearish movement
January 20, 2021

Comments are closed.

Caterpillar Inc. (CAT) up to 140.17 Apple Inc. approaching important 193.79 price line

Futures Statistical Analysis – TD

Soybean Oil excessive bearish movement

March 9, 2021 11:16 am | By Autochartist

Soybean Oil experienced a 19.04% bullish movement in the last... Read more →

Corn excessive bearish movement

March 8, 2021 11:19 am | By Autochartist

Corn experienced a 4.61% bullish movement in the last 73... Read more →

Gold Front Month excessive bearish movement

March 8, 2021 11:19 am | By Autochartist

Gold Front Month experienced a 6.29% bearish movement in the... Read more →

Light Sweet Crude Oil Front Month excessive bearish movement

March 8, 2021 11:19 am | By Autochartist

Light Sweet Crude Oil Front Month experienced a 8.6% bullish... Read more →

10 year T-Note excessive bearish movement

March 8, 2021 11:19 am | By Autochartist

10 year T-Note experienced a 3.4% bearish movement in the... Read more →

  • About Us
  • Privacy Policy
  • Disclaimer
  • Terms and Conditions
  • Get started for FREE
  • Contact Us
Copyright © 2020 Autochartist.com. All rights reserved.
This site uses cookies: Find out more.