Help & Documentation
  • Home
  • Sign In
  • Contact Us
  • Home
  • Sign In
  • Contact Us

KC HRW Wheat excessive bearish movement

/Futures Statistical Analysis - TD/KC HRW Wheat excessive bearish movement

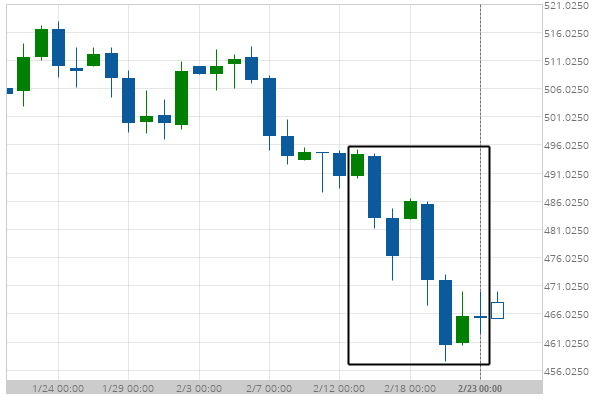
KC HRW Wheat excessive bearish movement

Posted on February 25, 2019 by Autochartist wrote in Futures Statistical Analysis - TD.

KC HRW Wheat experienced a 5.15% bearish movement in the last 10 days.

Tags: Big Movement, KE
0 Likes
851 Views

You may also like

10 year T-Note excessive bearish movement
August 12, 2020
Soybeans excessive bearish movement
July 1, 2020
KC HRW Wheat excessive bearish movement
May 28, 2019

Comments are closed.

Caterpillar Inc. (CAT) down to 126.55 Procter & Gamble Co. Target Level: 98.59

Futures Statistical Analysis – TD

Soybean Oil excessive bearish movement

March 9, 2021 11:16 am | By Autochartist

Soybean Oil experienced a 19.04% bullish movement in the last... Read more →

Corn excessive bearish movement

March 8, 2021 11:19 am | By Autochartist

Corn experienced a 4.61% bullish movement in the last 73... Read more →

Gold Front Month excessive bearish movement

March 8, 2021 11:19 am | By Autochartist

Gold Front Month experienced a 6.29% bearish movement in the... Read more →

Light Sweet Crude Oil Front Month excessive bearish movement

March 8, 2021 11:19 am | By Autochartist

Light Sweet Crude Oil Front Month experienced a 8.6% bullish... Read more →

10 year T-Note excessive bearish movement

March 8, 2021 11:19 am | By Autochartist

10 year T-Note experienced a 3.4% bearish movement in the... Read more →

  • About Us
  • Privacy Policy
  • Disclaimer
  • Terms and Conditions
  • Get started for FREE
  • Contact Us
Copyright © 2022 Autochartist.com. All rights reserved.
This site uses cookies: Find out more.