Help & Documentation
  • Home
  • Sign In
  • Contact Us
  • Home
  • Sign In
  • Contact Us

CORN JULY 2019 excessive bearish movement

/Futures Statistical Analysis - TD/CORN JULY 2019 excessive bearish movement

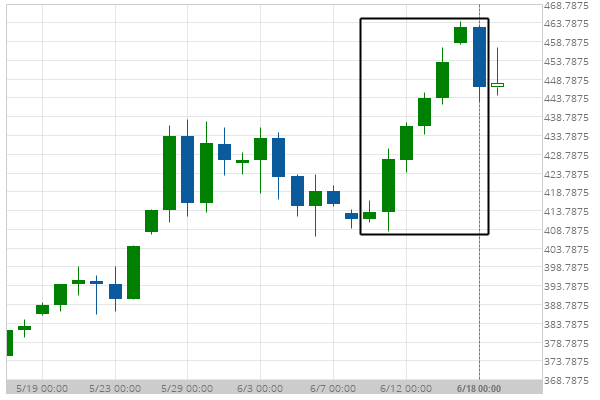
CORN JULY 2019 excessive bearish movement

Posted on June 19, 2019 by Autochartist wrote in Futures Statistical Analysis - TD.

CORN JULY 2019 experienced a 8.51% bullish movement in the last 8 days.

Tags: Big Movement, ZC
0 Likes
820 Views

You may also like

10 year T-Note excessive bearish movement
December 25, 2018
Silver Front Month excessive bearish movement
December 5, 2018
Soybean Meal excessive bearish movement
May 17, 2019

Comments are closed.

Soybean Meal excessive bearish movement 3m Co. – resistance line breached

Futures Statistical Analysis – TD

Soybean Oil excessive bearish movement

March 9, 2021 11:16 am | By Autochartist

Soybean Oil experienced a 19.04% bullish movement in the last... Read more →

Corn excessive bearish movement

March 8, 2021 11:19 am | By Autochartist

Corn experienced a 4.61% bullish movement in the last 73... Read more →

Gold Front Month excessive bearish movement

March 8, 2021 11:19 am | By Autochartist

Gold Front Month experienced a 6.29% bearish movement in the... Read more →

Light Sweet Crude Oil Front Month excessive bearish movement

March 8, 2021 11:19 am | By Autochartist

Light Sweet Crude Oil Front Month experienced a 8.6% bullish... Read more →

10 year T-Note excessive bearish movement

March 8, 2021 11:19 am | By Autochartist

10 year T-Note experienced a 3.4% bearish movement in the... Read more →

  • About Us
  • Privacy Policy
  • Disclaimer
  • Terms and Conditions
  • Get started for FREE
  • Contact Us
Copyright © 2022 Autochartist.com. All rights reserved.
This site uses cookies: Find out more.