Help & Documentation
  • Home
  • Sign In
  • Contact Us
  • Home
  • Sign In
  • Contact Us

Gold Front Month excessive bearish movement

/Futures Statistical Analysis - TD/Gold Front Month excessive bearish movement

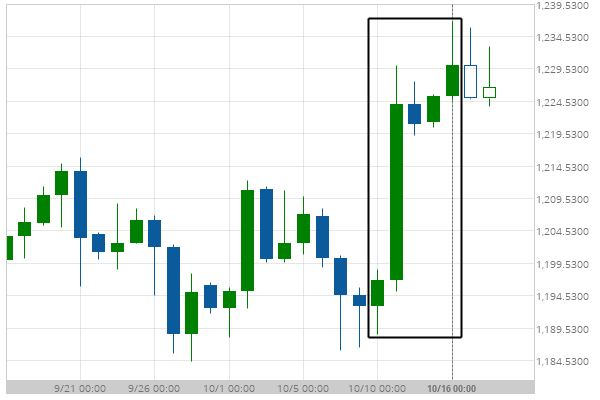
Gold Front Month excessive bearish movement

Posted on October 18, 2018 by Autochartist wrote in Futures Statistical Analysis - TD.

Gold Front Month experienced a 3.12% bullish movement in the last 5 days.

Tags: Big Movement, GC
0 Likes
1186 Views

You may also like

10 year T-Note excessive bearish movement
June 9, 2020
Soybean Oil excessive bearish movement
December 6, 2018
Soybeans excessive bearish movement
April 23, 2020

Comments are closed.

One line of code makes all the difference Coca-Cola Co. (KO) excessive bullish movement

Futures Statistical Analysis – TD

Soybean Oil excessive bearish movement

March 9, 2021 11:16 am | By Autochartist

Soybean Oil experienced a 19.04% bullish movement in the last... Read more →

Corn excessive bearish movement

March 8, 2021 11:19 am | By Autochartist

Corn experienced a 4.61% bullish movement in the last 73... Read more →

Gold Front Month excessive bearish movement

March 8, 2021 11:19 am | By Autochartist

Gold Front Month experienced a 6.29% bearish movement in the... Read more →

Light Sweet Crude Oil Front Month excessive bearish movement

March 8, 2021 11:19 am | By Autochartist

Light Sweet Crude Oil Front Month experienced a 8.6% bullish... Read more →

10 year T-Note excessive bearish movement

March 8, 2021 11:19 am | By Autochartist

10 year T-Note experienced a 3.4% bearish movement in the... Read more →

  • About Us
  • Privacy Policy
  • Disclaimer
  • Terms and Conditions
  • Get started for FREE
  • Contact Us
Copyright © 2022 Autochartist.com. All rights reserved.
This site uses cookies: Find out more.