Help & Documentation
  • Home
  • Sign In
  • Contact Us
  • Home
  • Sign In
  • Contact Us

US T-Bond excessive bearish movement

/Futures Statistical Analysis - TD/US T-Bond excessive bearish movement

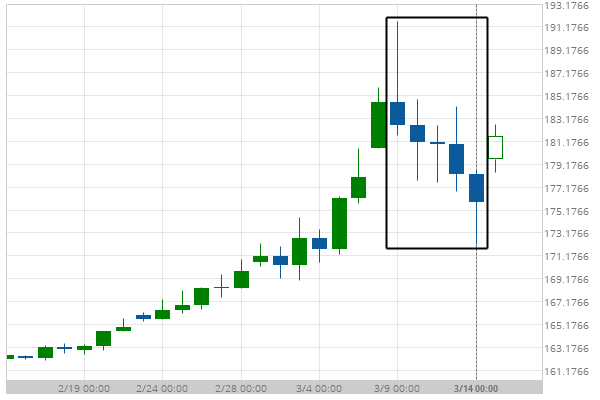
US T-Bond excessive bearish movement

Posted on March 16, 2020 by admin wrote in Futures Statistical Analysis - TD.

US T-Bond experienced a 3.7% bearish movement in the last 5 days.

Tags: Big Movement, ZB
0 Likes
239 Views

You may also like

Feeder Cattle Front Month excessive bearish movement
November 10, 2020
Soybean Oil excessive bearish movement
January 12, 2021
Silver Front Month excessive bearish movement
November 13, 2019

Comments are closed.

EUR/JPY up to 121.7313 Silver Front Month excessive bearish movement

Futures Statistical Analysis – TD

Soybean Meal excessive bearish movement

January 25, 2021 11:17 am | By admin

Soybean Meal experienced 6 consecutive bearish candles. Possible bullish price... Read more →

Feeder Cattle Front Month excessive bearish movement

January 25, 2021 11:17 am | By admin

Feeder Cattle Front Month experienced a 7.67% bullish movement in... Read more →

Soybeans excessive bearish movement

January 25, 2021 11:17 am | By admin

Soybeans experienced a 3.79% bearish movement in the last 61... Read more →

Lean Hogs excessive bearish movement

January 25, 2021 11:17 am | By admin

Lean Hogs experienced a 13.46% bullish movement in the last... Read more →

Corn excessive bearish movement

January 25, 2021 11:17 am | By admin

Corn experienced a 4.81% bearish movement in the last 66... Read more →

  • About Us
  • Privacy Policy
  • Disclaimer
  • Terms and Conditions
  • Get started for FREE
  • Contact Us
Copyright © 2020 Autochartist.com. All rights reserved.
This site uses cookies: Find out more.