Help & Documentation
  • Home
  • Sign In
  • Contact Us
  • Home
  • Sign In
  • Contact Us

KC HRW Wheat excessive bearish movement

/Futures Statistical Analysis - TD/KC HRW Wheat excessive bearish movement

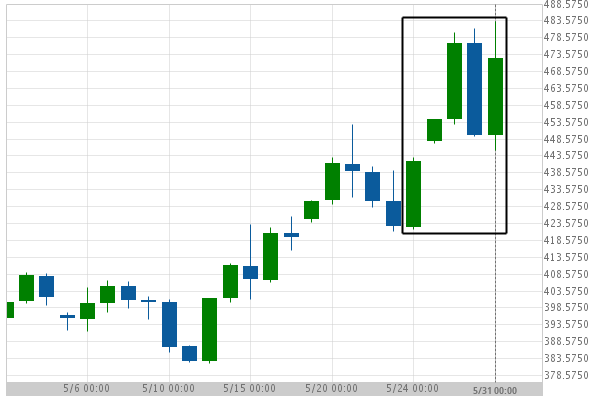
KC HRW Wheat excessive bearish movement

Posted on May 31, 2019 by Autochartist wrote in Futures Statistical Analysis - TD.

KC HRW Wheat experienced a 11.83% bullish movement in the last 7 days.

Tags: Big Movement, KE
0 Likes
844 Views

You may also like

Corn excessive bearish movement
June 10, 2019
US T-Bond excessive bearish movement
January 4, 2019
Silver Front Month excessive bearish movement
May 3, 2019

Comments are closed.

Intel Corporation (INTC) up to 45.25 Should we expect a breakout or a rebound on NZD/USD?

Futures Statistical Analysis – TD

Soybean Oil excessive bearish movement

March 9, 2021 11:16 am | By Autochartist

Soybean Oil experienced a 19.04% bullish movement in the last... Read more →

Corn excessive bearish movement

March 8, 2021 11:19 am | By Autochartist

Corn experienced a 4.61% bullish movement in the last 73... Read more →

Gold Front Month excessive bearish movement

March 8, 2021 11:19 am | By Autochartist

Gold Front Month experienced a 6.29% bearish movement in the... Read more →

Light Sweet Crude Oil Front Month excessive bearish movement

March 8, 2021 11:19 am | By Autochartist

Light Sweet Crude Oil Front Month experienced a 8.6% bullish... Read more →

10 year T-Note excessive bearish movement

March 8, 2021 11:19 am | By Autochartist

10 year T-Note experienced a 3.4% bearish movement in the... Read more →

  • About Us
  • Privacy Policy
  • Disclaimer
  • Terms and Conditions
  • Get started for FREE
  • Contact Us
Copyright © 2022 Autochartist.com. All rights reserved.
This site uses cookies: Find out more.