Help & Documentation
  • Home
  • Sign In
  • Contact Us
  • Home
  • Sign In
  • Contact Us

Gold Front Month down to 1291.3000

/Futures Technical Analysis - TD/Gold Front Month down to 1291.3000

Gold Front Month down to 1291.3000

Posted on April 1, 2019 by Autochartist wrote in Futures Technical Analysis - TD.

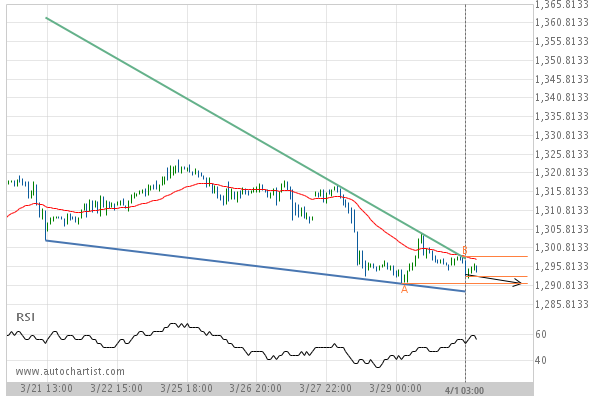
Falling Wedge identified at 01-Apr-2019 03:00 EDT. This pattern is still in the process of forming. Possible bearish price movement towards the support 1291.3000 within the next 2 days.

Tags: COMEX, GC
0 Likes
954 Views

You may also like

Soybean Oil down to 33.8000
December 31, 2019
Soybean Oil up to 28.2300
June 5, 2019
Corn down to 356.0000
April 23, 2019

Comments are closed.

10 year T-Note down to 123.6141 Light Sweet Crude Oil Front Month down to 59.7500

Futures Technical Analysis – TD

Light Sweet Crude Oil Front Month up to 67.9800

March 9, 2021 11:17 am | By Autochartist

Rising Wedge identified at 09-Mar-2021 05:00 EST. This pattern is... Read more →

Feeder Cattle Front Month down to 137.2250

March 9, 2021 11:17 am | By Autochartist

Channel Down identified at 08-Mar-2021 14:00 EST. This pattern is... Read more →

Soybean Oil up to 53.2300

March 9, 2021 11:17 am | By Autochartist

Channel Up identified at 09-Mar-2021 04:30 EST. This pattern is... Read more →

Silver Front Month up to 26.5600

March 9, 2021 11:17 am | By Autochartist

Approaching Resistance level of 26.5600 identified at 09-Mar-2021 04:00 EST Read more →

10 year T-Note up to 133.1644

March 9, 2021 11:17 am | By Autochartist

Falling Wedge has broken through the resistance line at 09-Mar-2021... Read more →

  • About Us
  • Privacy Policy
  • Disclaimer
  • Terms and Conditions
  • Get started for FREE
  • Contact Us
Copyright © 2022 Autochartist.com. All rights reserved.
This site uses cookies: Find out more.