Help & Documentation
  • Home
  • Sign In
  • Contact Us
  • Home
  • Sign In
  • Contact Us

10 year T-Note up to 135.9220

/Futures Technical Analysis - TD/10 year T-Note up to 135.9220

10 year T-Note up to 135.9220

Posted on March 19, 2020 by Autochartist wrote in Futures Technical Analysis - TD.

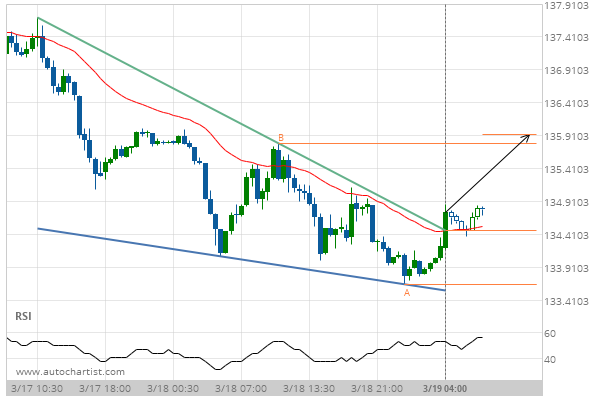
Falling Wedge has broken through the resistance line at 19-Mar-2020 04:00 EDT. Possible bullish price movement forecast for the next 10 hours towards 135.9220.

Tags: CBOT, ZN
0 Likes
617 Views

You may also like

Soybean Oil down to 30.0700
February 28, 2019
Corn down to 371.7500
February 15, 2019
Lean Hogs up to 72.1250
October 28, 2019

Comments are closed.

Soybeans up to 872.0000 3m Co. (MMM) excessive bearish movement

Futures Technical Analysis – TD

Light Sweet Crude Oil Front Month up to 67.9800

March 9, 2021 11:17 am | By Autochartist

Rising Wedge identified at 09-Mar-2021 05:00 EST. This pattern is... Read more →

Feeder Cattle Front Month down to 137.2250

March 9, 2021 11:17 am | By Autochartist

Channel Down identified at 08-Mar-2021 14:00 EST. This pattern is... Read more →

Soybean Oil up to 53.2300

March 9, 2021 11:17 am | By Autochartist

Channel Up identified at 09-Mar-2021 04:30 EST. This pattern is... Read more →

Silver Front Month up to 26.5600

March 9, 2021 11:17 am | By Autochartist

Approaching Resistance level of 26.5600 identified at 09-Mar-2021 04:00 EST Read more →

10 year T-Note up to 133.1644

March 9, 2021 11:17 am | By Autochartist

Falling Wedge has broken through the resistance line at 09-Mar-2021... Read more →

  • About Us
  • Privacy Policy
  • Disclaimer
  • Terms and Conditions
  • Get started for FREE
  • Contact Us
Copyright © 2022 Autochartist.com. All rights reserved.
This site uses cookies: Find out more.