Daily Forex Update: USD/CAD
By: Dima Chernovolov
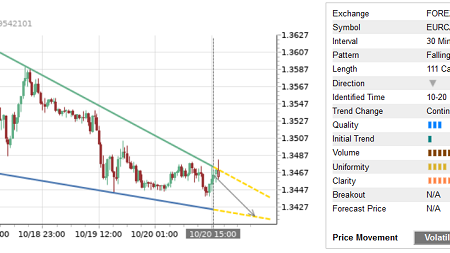
USD/CAD has been falling in the last few trading sessions inside the well-formed Falling Wedge chart pattern which was previously identified by Autochartist on the daily charts. Autochartist rates the quality of this Falling Wedge at the 5-bar level – which is the result of the slow Initial Trend (one bar), above-average Uniformity (6 bars) and significant Clarity (7 bars). USD/CAD is expected to fall further inside this chart pattern – in line with the earlier breakout of the key support level shown below.

As can be seen from the daily USD/CAD chart below, the price earlier broke the pivotal support level 1.2425 (which stopped the previous sharp daily impulse wave at the end of July). This price level is acting as resistance after it was broken. The proximity of this resistance level and the accelerating bearish CCI both increase the probability USD/CAD will continue to decline inside this Falling Wedge.

To subscribe to the e-mail alerts feature is quick and easy. Log into the Autochartist platform, click on ‘Alerts & Messaging’, enter your email address, select the market you want covered, select your language, and the time you want to get your report, and you’re done! You will now receive a quick morning technical outlook of the markets.
For further information on this and other Autochartist products visit www.autochartist.com