Daily Forex Update: NZD/JPY
By: Dima Chernovolov
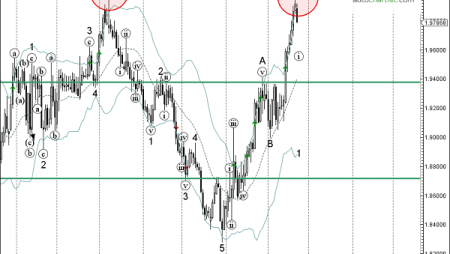
NZD/JPY continues to fall toward the Key Support level 80.69 (of the type Approach), which was recently identified by Autochartist on the 4-hour charts. Autochartist rates the Significance of this Support level at the 4-bar level – which is the result of the four previous price reversals from this price level. NZD/JPY is expected to fall toward this key support level in the coming trading sessions – continuing the recent downward price impulse from the nearby strong resistance zone, described below.

As you can see from the daily NZD/JPY chart below – the price earlier reversed down from the strong resistance zone lying between the long-term resistance level 83.400 (which has been steadily reversing the pair from 2015) and the upper weekly Bollinger Band. The proximity of this resistance zone should strengthen bearish pressure on this currency pair – increasing the probability the price will soon reach the key support level 80.69.

To subscribe to the e-mail alerts feature is quick and easy. Log into the Autochartist platform, click on ‘Alerts & Messaging’, enter your email address, select the market you want covered, select your language, and the time you want to get your report, and you’re done! You will now receive a quick morning technical outlook of the markets.
For further information on this and other Autochartist products visit www.autochartist.com