Daily Forex Update: EUR/NZD
By: Dima Chernovolov
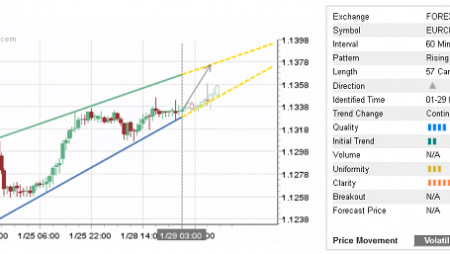
EUR/NZD recently broke the Clear Triangle chart pattern which was earlier identified by Autochartist on the 4-hour charts. Autochartist rates the overall Quality of this chart pattern at the 7 bar level – which is the result of the slow Initial Trend (3 bars), below-average Uniformity (4 bars) and near-maximum Clarity (9 bars). The strength of this breakout is rated at the maximum, 10-bar level – which adds to the likelihood EUR/NZD will soon reach the forecast price 1.5393.

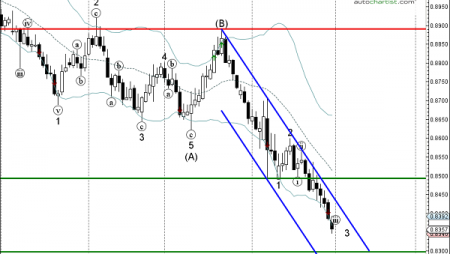
As can be seen from the daily EUR/NZD chart below, the bottom of this Triangle formed when the pair reversed up from the powerful support zone lying between the pivotal support level 1.5100 (which has been reversing the pair from July) and the lower daily Bollinger Band. The oversold reading on the daily Stochastic indicator increases the probability EUR/NZD will continue to rise toward the forecast price 1.5393 tomorrow.

To subscribe to the e-mail alerts feature is quick and easy. Log into the Autochartist platform, click on ‘Alerts & Messaging’, enter your email address, select the market you want covered, select your language, and the time you want to get your report, and you’re done! You will now receive a quick morning technical outlook of the markets.
For further information on this and other Autochartist products visit www.autochartist.com