Trade of the Day: NZD/CAD
By: Dima Chernovolov
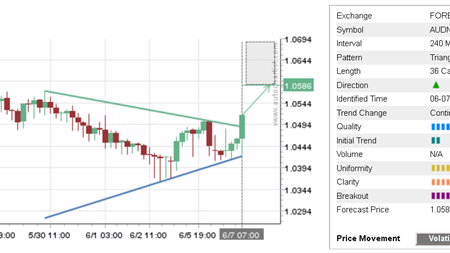
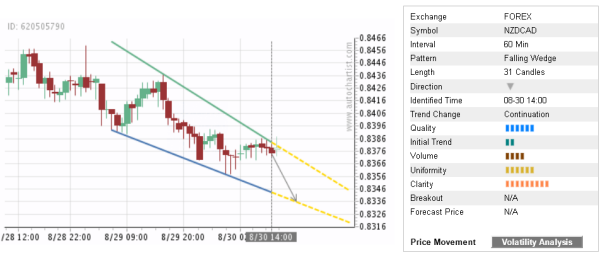
NZD/CAD continues to fall inside the hourly Falling Wedge chart pattern which was identified previously by Autochartist. Autochartist measures the quality of this Falling Wedge at the 6-bar level – which reflects the slow Initial Trend (2 bars), above-average Uniformity (6 bars) and strong Clarity (8 bars). NZD/CAD is expected to fall further inside this Falling Wedge – in line with the earlier breakout of the key support level shown below.
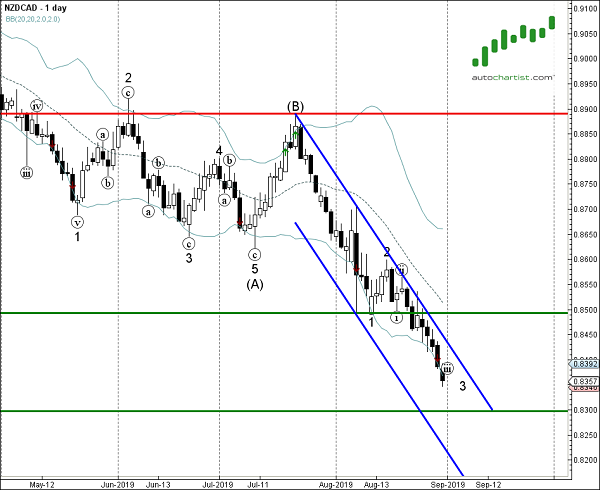
As can be seen from the daily NZD/CAD chart below, the price earlier broke the key support level 0.8500 (which previously reversed the price three times from the start of August). This price level is acting as strong resistance after it was broken. The proximity of this resistance level and the strength of the dually downtrend increase the probability NZD/CAD will continue to fall inside this Falling Wedge.