Daily Forex Update: AUD/NZD
By: Dima Chernovolov
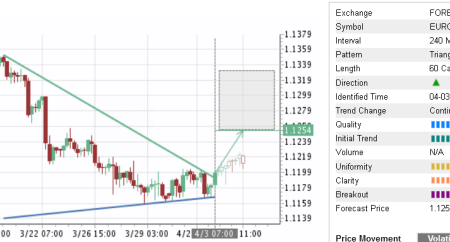
AUD/NZD continues to fall inside the Clear Triangle chart pattern which was previously identified by Autochartist on the daily charts. Autochartist rates the Quality of this Triangle at the 5 bar level – which reflects the below-average Initial Trend (4 bars), average Uniformity (5 bars) and substantial Clarity (7 bars). AUD/NZD is expected to fall further toward the lower support trendline of this Triangle.

As can be seen from the daily AUD/NZD below, the top of this Triangle formed when the pair reversed down from the resistance area lying between the long-term resistance level 1.07400 (which also reversed the pair in July and August), upper daily Bollinger Band and 50% Fibonacci correction of the downward impulse from April. The proximity of this resistance zone increases the probability AUD/NZD will continue to fall inside this Triangle.

To subscribe to the e-mail alerts feature is quick and easy. Log into the Autochartist platform, click on ‘Alerts & Messaging’, enter your email address, select the market you want covered, select your language, and the time you want to get your report, and you’re done! You will now receive a quick morning technical outlook of the markets.
For further information on this and other Autochartist products visit www.autochartist.com