Daily Forex Update: AUD/CAD
By: Dima Chernovolov
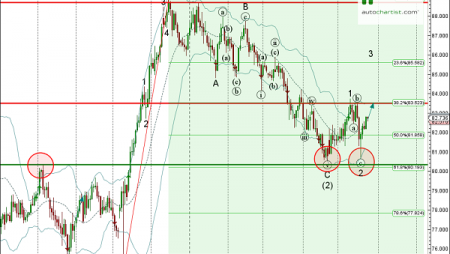
AUD/CAD continues to fall after the recent breakout of the Descending Triangle chart pattern which was previously identified by Autochartist on the 30-minute charts. Autochartist measures the Quality of this Descending Triangle at the 6-bar level – which reflects the slow Initial Trend (2 bars), average Uniformity (5 bars) and high Clarity (9 bars). Autochartist measures the strength of this Triangle breakout at the maximum, 10-bar level, which increases the probability AUD/CAD will soon reach the forecast price 0.9850.

As can be seen from the daily AUD/CAD chart below, the breakout of this Descending Triangle follows the earlier breakout of the strong support area lying between the key support level 0.9960 (which has been reversing the pair from April) and the 50% Fibonacci correction of the upward impulse from December. This price area is acting as resistance zone after it was broken. The proximity of this resistance zone adds to the likelihood AUD/CAD will continue to fall toward the forecast price 0.9850.

To subscribe to the e-mail alerts feature is quick and easy. Log into the Autochartist platform, click on ‘Alerts & Messaging’, enter your email address, select the market you want covered, select your language, and the time you want to get your report, and you’re done! You will now receive a quick morning technical outlook of the markets.
For further information on this and other Autochartist products visit www.autochartist.com