Help & Documentation
  • Home
  • Sign In
  • Contact Us
  • Home
  • Sign In
  • Contact Us

CORN JULY 2019 down to 410.7500

/Futures Technical Analysis - TD/CORN JULY 2019 down to 410.7500

CORN JULY 2019 down to 410.7500

Posted on June 10, 2019 by Autochartist wrote in Futures Technical Analysis - TD.

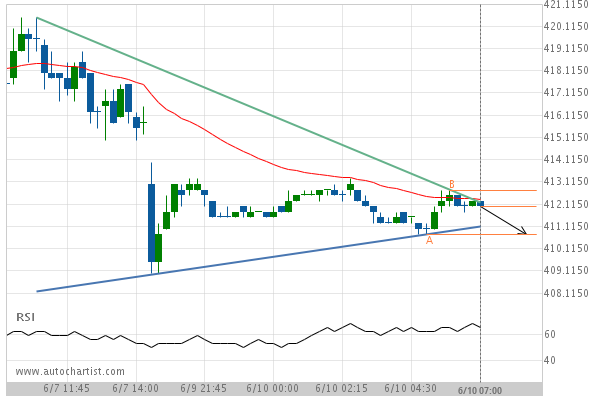
Triangle identified at 10-Jun-2019 07:00 EDT. This pattern is still in the process of forming. Possible bearish price movement towards the support 410.7500 within the next 5 hours.

Tags: CBOT, ZC
0 Likes
785 Views

You may also like

Corn down to 371.7500
February 14, 2019
10 year T-Note up to 139.2656
April 21, 2020
US T-Bond up to 178.0313
June 24, 2020

Comments are closed.

Trade of the Day: AUD/USD US T-Bond down to 153.0938

Futures Technical Analysis – TD

Light Sweet Crude Oil Front Month up to 67.9800

March 9, 2021 11:17 am | By Autochartist

Rising Wedge identified at 09-Mar-2021 05:00 EST. This pattern is... Read more →

Feeder Cattle Front Month down to 137.2250

March 9, 2021 11:17 am | By Autochartist

Channel Down identified at 08-Mar-2021 14:00 EST. This pattern is... Read more →

Soybean Oil up to 53.2300

March 9, 2021 11:17 am | By Autochartist

Channel Up identified at 09-Mar-2021 04:30 EST. This pattern is... Read more →

Silver Front Month up to 26.5600

March 9, 2021 11:17 am | By Autochartist

Approaching Resistance level of 26.5600 identified at 09-Mar-2021 04:00 EST Read more →

10 year T-Note up to 133.1644

March 9, 2021 11:17 am | By Autochartist

Falling Wedge has broken through the resistance line at 09-Mar-2021... Read more →

  • About Us
  • Privacy Policy
  • Disclaimer
  • Terms and Conditions
  • Get started for FREE
  • Contact Us
Copyright © 2022 Autochartist.com. All rights reserved.
This site uses cookies: Find out more.