Help & Documentation
  • Home
  • Sign In
  • Contact Us
  • Home
  • Sign In
  • Contact Us

Gold Front Month down to 1513.7000

/Futures Technical Analysis - TD/Gold Front Month down to 1513.7000

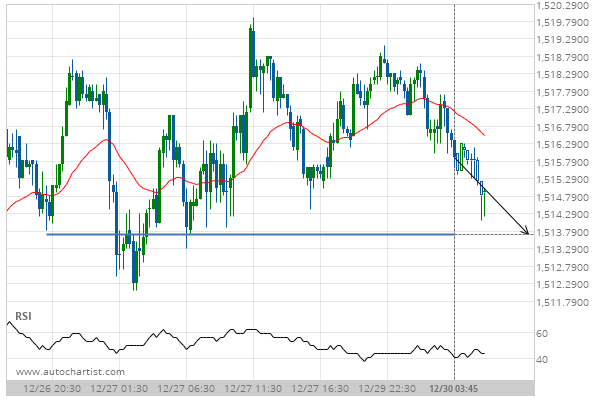
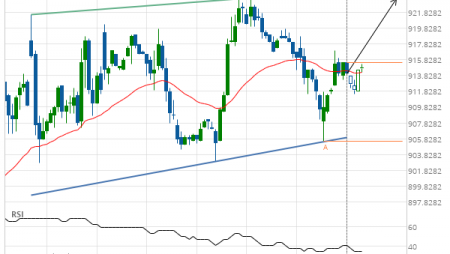
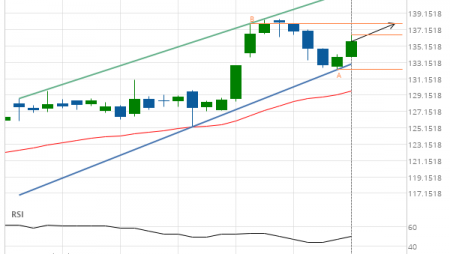
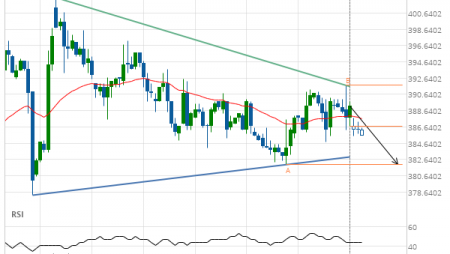
Gold Front Month down to 1513.7000

Posted on December 30, 2019 by Autochartist wrote in Futures Technical Analysis - TD.

Approaching Support level of 1513.7000 identified at 30-Dec-2019 03:45 EST

Tags: GC
0 Likes
614 Views

You may also like

US T-Bond down to 146.0938
February 18, 2019
Soybean Meal down to 307.9244
April 10, 2019
10 year T-Note down to 137.2344
December 7, 2020

Comments are closed.

10 year T-Note down to 128.0313 Nike Inc. Cl B (NKE) down to 100.15

Futures Technical Analysis – TD

Light Sweet Crude Oil Front Month up to 67.9800

March 9, 2021 11:17 am | By Autochartist

Rising Wedge identified at 09-Mar-2021 05:00 EST. This pattern is... Read more →

Feeder Cattle Front Month down to 137.2250

March 9, 2021 11:17 am | By Autochartist

Channel Down identified at 08-Mar-2021 14:00 EST. This pattern is... Read more →

Soybean Oil up to 53.2300

March 9, 2021 11:17 am | By Autochartist

Channel Up identified at 09-Mar-2021 04:30 EST. This pattern is... Read more →

Silver Front Month up to 26.5600

March 9, 2021 11:17 am | By Autochartist

Approaching Resistance level of 26.5600 identified at 09-Mar-2021 04:00 EST Read more →

10 year T-Note up to 133.1644

March 9, 2021 11:17 am | By Autochartist

Falling Wedge has broken through the resistance line at 09-Mar-2021... Read more →

  • About Us
  • Privacy Policy
  • Disclaimer
  • Terms and Conditions
  • Get started for FREE
  • Contact Us
Copyright © 2022 Autochartist.com. All rights reserved.
This site uses cookies: Find out more.